Test Equipment System Integrator | NI Integrators
Custom Test System Integration for mission-critical applications
Over 2,000 NI-based automated test systems delivered
Automated test equipment system integration | NI system integration
NI System Integrators
We design and build LabVIEW-based test systems and integrate both NI hardware and supporting hardware.


Capabilities & Expertise
NI platform selection & integration
NI software selection & integration
NI module selection & integration
Supporting hardware selection & integration
Sensor selection & integration (common, but not exhaustive, measurement types)


Test System Case Studies
Fixing and Updating TestStand & LabVIEW for a New Power Distribution Product
Fixing and Updating TestStand & LabVIEW for a New Power Distribution Product
Dealing with frustration from a prior development effort and wanting to update testing capabilities with LabVIEW and TestStand
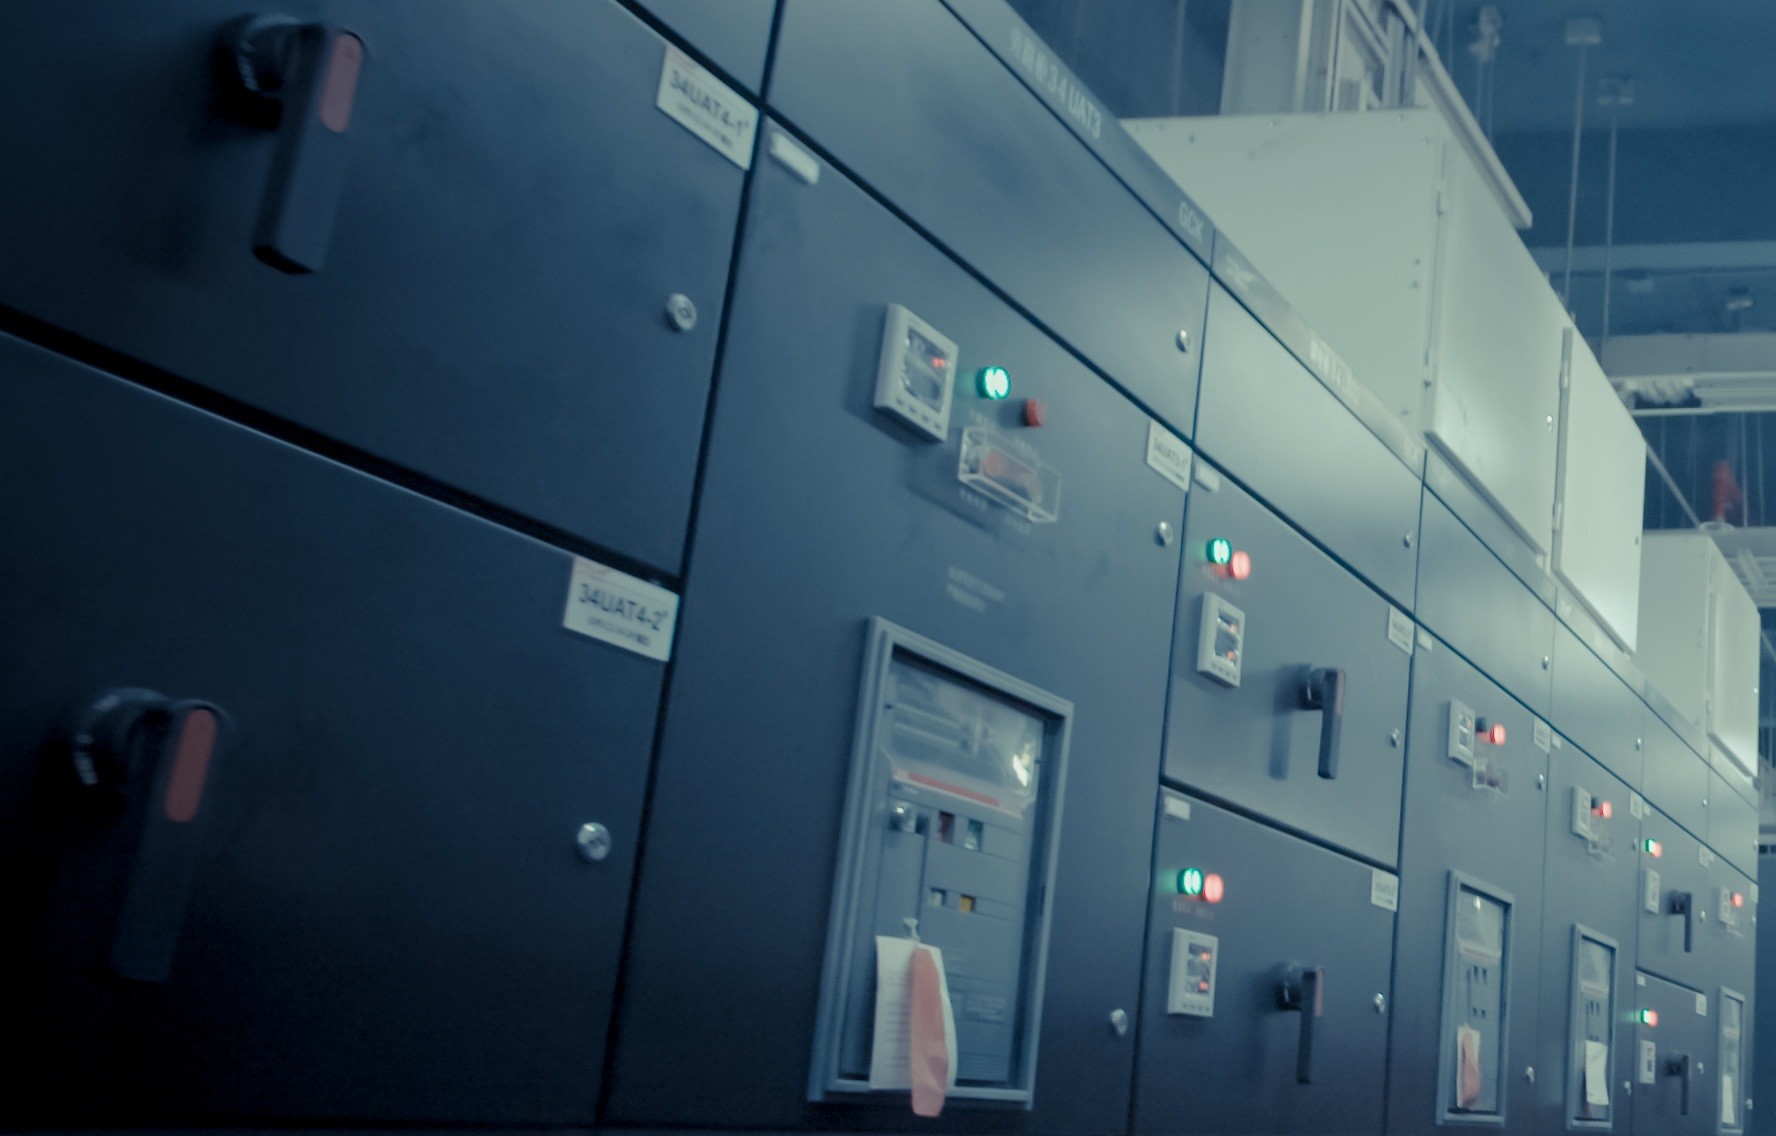
Client – Starline, a Brand of Legrand, a global leader in customizable power distribution solutions
Challenge
In their ongoing pursuit of high-quality products, Starline, a Brand of Legrand, wanted to regression test the firmware being developed for the M70 Critical Power Monitor, one of their new electrical power metering products. Starline requested Viewpoint to step into a project that was already underway.
Starline had existing TestStand / LabVIEW code already in place from a prior generation of the meter, but it had performance issues and, more importantly, it didn’t support the next generation of product. The existing code was developed both internally and externally in collaboration with another system integrator; however, Starline was in search of a new partner to help take the project across the finish line.
We needed to quickly learn the existing codebase to deliver the requested enhancements while rebuilding trust after Starline’s difficult experience with the previous system integrator.
Solution
Starline developed a detailed Statement of Work as guidance for the outstanding tasks. The initial scope was directed at supporting the new product line, which the existing software did not include.
Going through the process of learning the existing software, we noticed several areas in which the code was ”fragile” due, in part, to:
- Inadequate architectural design choices,
- Duplicated code blocks, which complicated bug fixes and maintenance,
- Telnet comms rather than more basic serial comms,
- Misalignment in capability between the test software and the product firmware,
- False Pass conditions due to inadequate error handling, and
- UI complexities, which made it challenging for the operator to manage the test flow.
In collaboration with Starline, we agreed to strengthen the architecture and codebase before introducing new capabilities, then return to the original objective of supporting the new products.
Working Together
We were able to gain Starline’s trust by showing them our collaborative process through resolving issues within the existing code architecture and code base. We were then able to work together to define the tasks required to correct these issues.
Throughout the work, project management went smoothly. Starline’s project manager was detail-oriented, engaged, and approachable. Software tasks were managed with Jira and tasks were reviewed at weekly status meetings. This approach ensured that all issues were being tracked and that everyone was aware of progress being made to resolve them.
Our involvement in this project was completely remote (i.e., we were ready to go on-site but it was not needed). Admittedly, there were minor challenges around this work arrangement, but we were able to work together to iron out the wrinkles. For example, because the firmware was still in development, sometimes the Unit Under Test (UUT) would freeze due to a change in the latest firmware. A reboot of the UUT was needed, which required a person to power cycle the UUT. After a discussion, we decided to expose the soft front panel of the power supply so we could remotely power-cycle the UUT.
This simple and cost-effective solution helped illustrate the importance of a great relationship between the test system integrator and the client.
Benefits
How we helped
We were able to help Starline by providing:
System Overview
The new product line is aimed at supporting the ever-growing need for high-density power in data centers, high performance computing, and AI centers by providing data on real-time voltage, current, and power. Standard communication protocols are used to ensure seamless integration with virtually any Building Management system (BMS) or Data Center Infrastructure Management system (DCIM).
Since the product and its various configurations were completely testable through various communication protocols, the test system was able to run all tests by sending commands to the unit and reviewing its responses.
In the real world, certain configurations of the product would connect to external equipment, or the product might have some additional subassemblies installed.
Starline determined they would develop special firmware to simulate these additions. This prototype test firmware would simulate responses to messages as in the real-world. In similar fashion, faults were simulated with this prototype test firmware. Then, the test system was able to test all configurations, real and simulated, for a comprehensive exercise of the product’s firmware.
We used both serial RS-485 and Ethernet for baseline communications with support for several protocols, such as:
- Serial RS-485
- SSH
- ModbusTCP
- ModbusRTU
- BACNet
- SNMP v1
- SNMP v2
- SNMP v3
- SNMP v3 Traps
Because our involvement was requested after the project had already been started, Starline provided the test system hardware and initial software. Our job was to refactor, clean, and add functionality to the software to test the new product’s firmware.
| SOFTWARE FUNCTIONS |
|---|
| TestStand |
| LabVIEW |
| HARDWARE USED |
|---|
| USB to RS-485 serial converter |
| Ethernet |

Validating firmware on a new controller for a mining vehicle
Validating firmware on a new controller for a mining vehicle
Combining VeriStand and TestStand to simulate subsystems for controller firmware testing
Client – A global supplier of heavy mining machinery

Challenge
The client was developing microcontroller firmware to manage part of their mining machine. This machine is too large and expensive to use for initial testing of the firmware. Instead, models were needed to simulate subsystems of the machine to test proper operation of firmware. And, the subsystems had to be sequenced through various states that the machine controller would encounter in actual use.
Solution
We developed a series of VeriStand models for the subsystems to run on a PXI RT controller. Then we developed some TestStand sequences to “drive” the machine through a set of simulations by setting the VeriStand model parameters. The sequences ran through certain scenarios to check performance of the controller firmware to a known sequence of conditions while validating the controller actions.
We acted as an extension of our client’s engineering team. Our client had engineering capabilities in VeriStand and TestStand to do the work themselves but did not have the capacity for the work at the time.
Benefits
Working Together
Our initial engagement with this team dealt with requirements gathering. We discussed managing this project with traditional Waterfall methods, where requirements are completed before going to design, but it was decided to manage closer to an Agile methodology, where we defined a short-term goal and adjusted subsequent steps as we progressed.
The main reason for this choice was that our client was busy developing the firmware at the same time Viewpoint was developing the simulation models. In other words, they wanted to “get going” in order to highlight design issues earlier than later.
The fact that we both had experience and knowledge about VeriStand and TestStand, made the status discussions quite technical and productive. Consequently, Agile worked well for this project.
How we helped
We helped our client in the development of their controller firmware by offering:
System Overview
The models we developed had to adjust their internal state to simulate the motion of the machine. The models reacted to messages from the firmware and passed back appropriate responses to the microcontroller.
The messages adhered to the J1939 CAN protocol. The models communicated to the microcontroller via PXI-8512 NI-XNET CAN modules in the PXI chassis.
The VeriStand models were all developed in LabVIEW for deployment on the PXI RT target running the VeriStand Engine. We were able to leverage a VeriStand custom device for J1939 previously developed by NI and hosted on GitHub. This code was useful because we had to extend the standard X-NET for this project . TestStand, VeriStand, and some Python code ran on a separate PC connected to the PXI RT controller to round out the testing environment.
The vehicle model received some digital signals for low level safety redundancy in case somehow the comms stopped functioning. For example, a digital heartbeat was output and some digital signals from the controller were used to indicate low-level state such as E-stop.
The TestStand sequences covered a wide range of motion situations and we expect that our client will create additional sequences for different simulations once we’ve completed the system foundation and essential test plans.
This table lists the main components used in this test system.
| SOFTWARE FUNCTIONS |
|---|
| LabVIEW |
| VeriStand |
| TestStand |
| Python |
| HARDWARE USED |
|---|
| PXIe-1088 Chassis |
| PXIe-8822 Controller |
| PXI-6511 Digital Inputs |
| PXI-6512 Digital Outputs |
| PXI-8512 CAN |
Transonic Wind Tunnel Test System Upgrade
Transonic Wind Tunnel Test System Upgrade
Improved Reliability, Reduced Stress, and New Tools People Want to Use.
Client – Calspan
(tunnel image courtesy of Calspan)

Challenge
Calspan operates a transonic wind tunnel capable of continuous Mach-speed testing a wide range of aircraft designs.
The overall test system was comprised of three subsystems that were all state of art at the time of design, over 20 years ago, but components were either obsolete or soon becoming so.
Calspan contacted us, and others in a competitive bid, to design, reuse, replace, and build a new test stand to maintain and even upgrade the test capabilities. At a high level, the requirements were to provide similar signal conditioning, hardware functionality, and software user experience.
Working together
Collaboration between our teams was key to success for this upgraded test system.
From the start, we all agreed that we’d have to do some reverse engineering to extract the details and nuances of the existing test system. This task was accomplished by reviewing existing items such as documentation and C++ code. As anyone who has done obsolescence upgrades knows, sometimes the source code is the best source for system requirements due to the wealth of details inherent in source code. Also, some aspects of system operation could not be easily documented, and Calspan personnel helped with defining the desired user interface and user experience.
The reverse engineering effort was enlightening and critical to assure that we all knew where we were headed.
Some highlights of design topics on which we collaborated:
The balance between full automation and manual operation was also discussed during initial collaboration. Calspan felt more comfortable with, and was familiar with, operating in a semi-manual mode, where walking through a test sequence was best handled semi-automatically with a set of operators at their stations. Nevertheless, we were able to suggest some improvements to the system useability and extensibility. For example:
Overall, we followed an iterative, Agile-like approach to design while using the technical details of the existing hardware and source code from the three subsystems to dictate the requirements necessary to reproduce, and even extend, the existing functionality.
Solution
The data acquisition part of the test system was implemented in two parts:
- a Precision Filters, Inc. (PFI) signal conditioning front end and,
- a National Instruments PXIe data acquisition chassis and modules. The PXIe chassis is connected to a server-class PC with MXI to handle all the acquired data and communication messaging between this test system and other special instruments and subsystems.
The signal conditioning was implemented with 128 channels of Precision Filters, Inc. 28124 transducer conditioner. This hardware is the only equipment on the market that met the needs of the client due to its capabilities for voltage and current excitation and a slew of gain and analog filtering options. PFI equipment is used extensively in wind tunnel and other critical measurement applications where performance, stability, and reliability are crucial, so the fit made a lot of sense. Also worth noting, although PFI offers an API to their chassis to enable automated or interfaced calibration, we chose to use their native calibration application because it just works and our interface would have been just a thin shell talking to their software.
The PXIe data acquisition is comprised of 128 channels of 24-bit, 200 kS/s digitizer analog input and additional 24-bit, 5 kS/s digitizer analog inputs. The PXI equipment is connected to a server-class PC via an MXI interface. The MXI interface offered the required bandwidth, and the server-class PC had plenty of processing power to manage the data flow from A/D to file storage while tending to the user displays. This arrangement is capable of simultaneous processing, alarming, visualization, and storage to disk at full rate.
Software was implemented almost entirely using Visual Studio C# and .NET 8.0. A small, but important, signal transformation portion was developed in LabVIEW Real Time on a Compact RIO.
User interface, test and sensor configuration, data acquisition, data processing, data storage, force balance calibration and alarming are all implemented in .NET.
Another overall goal was Calspan’s desire to maintain the application software. We tackled this goal in two ways:
- First, the original software spanned 4 code bases: 3 for the 3 subsystems mentioned above and 1 for calibration measurements. Not an ideal arrangement for software maintenance. When we rewrote in C#, the code base was refactored so that common software classes could be shared, such as data acquisition functionality.
- Second, it is very typical that Calspan’s customers have some unique measurement requirement such as specific sensor selection or additional measurement or control equipment. These requests are more easily accommodated by Calspan now, as compared to the previous system, because the refactoring and combining of the apps simplifies code edits.
Benefits
The main benefits of this obsolete test system upgrade were:
Also important to mention is the benefit of working with a collaborative team. The existing system, composed of the multiple subsystems, was complex with many subtleties. As with many older systems, the existing documentation was missing some important requirements – it’s just plain hard writing requirements. Without Calspan and Viewpoint having an open dialog and willingness to spend the time to understand options and make appropriate tradeoffs, the benefits of this upgrade project would not have been realized as cleanly. The collaboration was especially important in the design and acceptance testing phases of the project.
With this upgrade, Calspan has a reliable and flexible testing platform.
The previous hardware was degrading and, while not preventing tests from proceeding, channels were increasingly unusable as they failed. The replacement data acquisition hardware upgrades the previous test system with 128 high-speed channels, up from 96, and adds 32 low-speed channels. Previously, the test system acquired these high-speed channels at 100 kS/s per channel. Now the high-speed channels can be acquired at 200 kS/s per channel. All channels are now at 24-bit resolution up from 16-bit, vastly improving dynamic range. Finally, the fast- and low-speed channels can be combined into 160 channels of low-speed data with alarms (via real-time signal processing).
This new and modernized wind tunnel test system also brings faster test configuration. Calspan noted to us that two of the biggest improvements for a test setup configuration are having software-selectable filtering (i.e., not needing to change hardware modules) and having integrated multi-rate data acquisition (i.e., without having to patch in and set up separate acquisition hardware). Calspan estimates saving 2 to 4 hours per test setup.
Moving forward, Calspan will be able to satisfy their customer’s needs with this improved test system performance and the ability to reconfigure or expand functionality for future programs.
How we helped
System Overview

| SOFTWARE FUNCTIONS |
|---|
| Channel configuration |
| Alarming |
| Real-time graphs |
| Calibration for 6-axis and 1-axis sensors |
| Data storage |
| HARDWARE USED |
|---|
| Dual 19″ rack test stand |
| Precision Filters 28124 modules, 28000 chassis, and associated connectivity hardware |
| NI PXIe modules and chassis for high-speed AI |
| NI cDAQ and cRIO for AIO and DIO |
| Server-class PC |

Selecting replacement hardware for an obsolete test system
Selecting replacement hardware for an obsolete test system
A disaster hits – repair to meet schedule, and then upgrade after
Client – A major aerospace company

Challenge
Our client’s design validation test system was about 10 years old. They realized that the NI hardware in the test system was soon to be obsolete and they would have to upgrade it someday.
That day came sooner than expected when an issue in the test cell room caused excessive temperatures and smoke, overheating some PXI hardware and other components in the test rack. The test system had to be upgraded. (Everyone was OK – the issue was handled quickly.)
The timing of this event was especially unfortunate, as they were in the middle of some testing that needed to be completed to meet a schedule so that they didn’t hold up the design team.
So, the client made the decision to replace the existing PXI modules with the same type, rather than upgrading directly – that upgrade would have to come later. But, even after replacing the failed modules with the same part numbers, something wasn’t correct since the system didn’t work.
Working toward a solution together
Our client contacted us for help get them past this hurdle.
It turned out that the software for the original system was developed by a one-man system integrator with whom we occasionally collaborate. Our client asked that integrator to help, but he was unable to respond rapidly, so we worked with this integrator to pick his brain about possible causes, but no obvious solution was forthcoming.
We dug into the issue, which was a timing error, and discovered that one of the replacement boards needed a hardware driver update, even though the catalog part number was the same as the module being replaced.
This troubleshooting was best suited for someone with intimate knowledge of NI hardware – it took longer to figure out the issue than it did to fix it.
With that issue resolved, and after our client performed their tests, they asked us to start designing a test system to replace the soon-to-be obsolete hardware with new hardware.
Replacement with new hardware was not a one-to-one swap, making this design a perfect fit for our Hardware Selection Services consulting.
We took the details and requirements of the existing test system and figured out the replacement hardware. We needed to consider channel counts, acquisition rates, and costs. For example, the Sound and Vibration card in the original system had 8 channels but a replacement only had either 4 or 6 channels. Other tradeoffs were also made.
Our approach for this type of consultation:
- starts with recommendations to the client,
- followed by discussion about pros and cons,
- and ending (maybe after a few iterations) with a replacement system that meets the functionality of the original system. The client even added some additional functionality he’d been wanting for a while.
The cost of this consultation service was covered by purchasing of the hardware from Viewpoint, and, in this instance, that portion of our service offering worked to the client’s advantage because we worked with him to split the order into two parts to help him meet his budget and scheduling needs due to some long-lead items. Specifically, we worked with NI to swap a controller running the latest version of Windows with one that ran the previous version so that we could hit shipping dates 5 weeks earlier than otherwise. Our experience with the NI buying process was critical to rectifying this situation; a typical NI customer wouldn’t have thought to check for this solution.
After the arrival of the new system, we were contracted by the client to rework the software to use the new hardware. Updated drivers were needed, of course, but since the original integrator had given the client the application LabVIEW source code, we could decipher how it operated and were able to determine how to incorporate the new and different channel configurations per card plus supporting the functionality that the additional cards offered. Once the configuration of this new hardware setup was completed, we tested that the application was once again working as expected.
Benefits
Working with an integrator that offers both consulting for selecting new NI hardware coupled with turnkey test system design and build capabilities enabled our client to move from a broken system to a new one in stages.
This approach enabled them to complete their scheduled tests as quickly as possible while giving them a path to the future based on the new system that we helped them build and deploy.
How we helped
For this project, we mostly helped with the selection and replacement of NI hardware with a little side help from some system integration services to bring the test system application software to full functionality.
System Overview
| SOFTWARE FUNCTIONS |
|---|
| LabVIEW app for data acquisition, display, and storage |
| Configuration of channels through MAX for connection to the LabVIEW app via DAQmx |
| Test sequencing definition for system control via output channels |
| HARDWARE USED – (for replacement system) |
|---|
| NI PXIe controller and chassis |
| NI Sound and Vibration cards |
| NI Timing and sync card |
| NI Thermocouple card |
| NI General analog I/O |
Manufacturing Test System – Aircraft turbine blade quality inspection
Manufacturing Test System – Aircraft turbine blade quality inspection
Improving quality by detecting blocked holes in aircraft turbine blades with an automated test system

Client – Large aerospace company
Challenge
Fuel-fed aircraft turbines run extremely hot. At very high temperatures, a turbine’s blades suffer a shorter life span than if run at cooler temperatures. Consequently, turbine manufacturers put cooling holes in the blades to lower the blade temperature during operation. These holes carry cool air or gas from the blade mount along channels that eventually arrive at holes in the blade surface. This practice keeps the blade much cooler than without the flow.
Some blades have a huge number of holes. Inspecting that each hole is open and has sufficient flow is time-consuming and, if inspected by a person, prone to error due to boredom and distraction. Plus, carpal tunnel syndrome issues are present due to repetitive motions. Multiply these issues by the large number of blades in each turbine and inspection becomes a significant effort.
Our client wanted to implement an automated inspection station to increase throughput and decrease mistakes. Sending defective blades down to the subsequent manufacturing steps is pure manufacturing waste when they are rejected at some later step. Reducing operator injury was also important.
Image courtesy of CC by 4.0 https://creativecommons.org/licenses/by/4.0/ from Zhang, R.; Liu, P.; Zhang, X.; Xi, W.; Liu, J.; “Recent Developments in the Aerodynamic Heat Transfer and Cooling Technology of Gas Turbines Endwalls”. Aerospace 2023, 10, 702. https://doi.org/10.3390/aerospace10080702
Solution
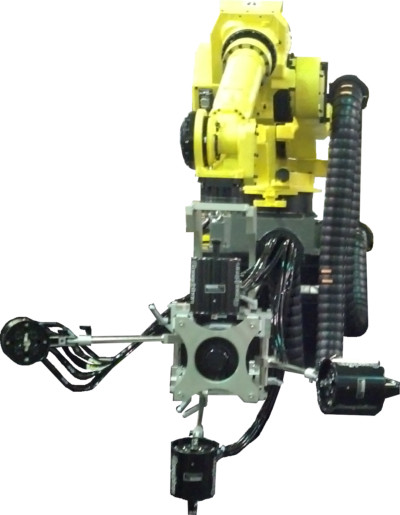
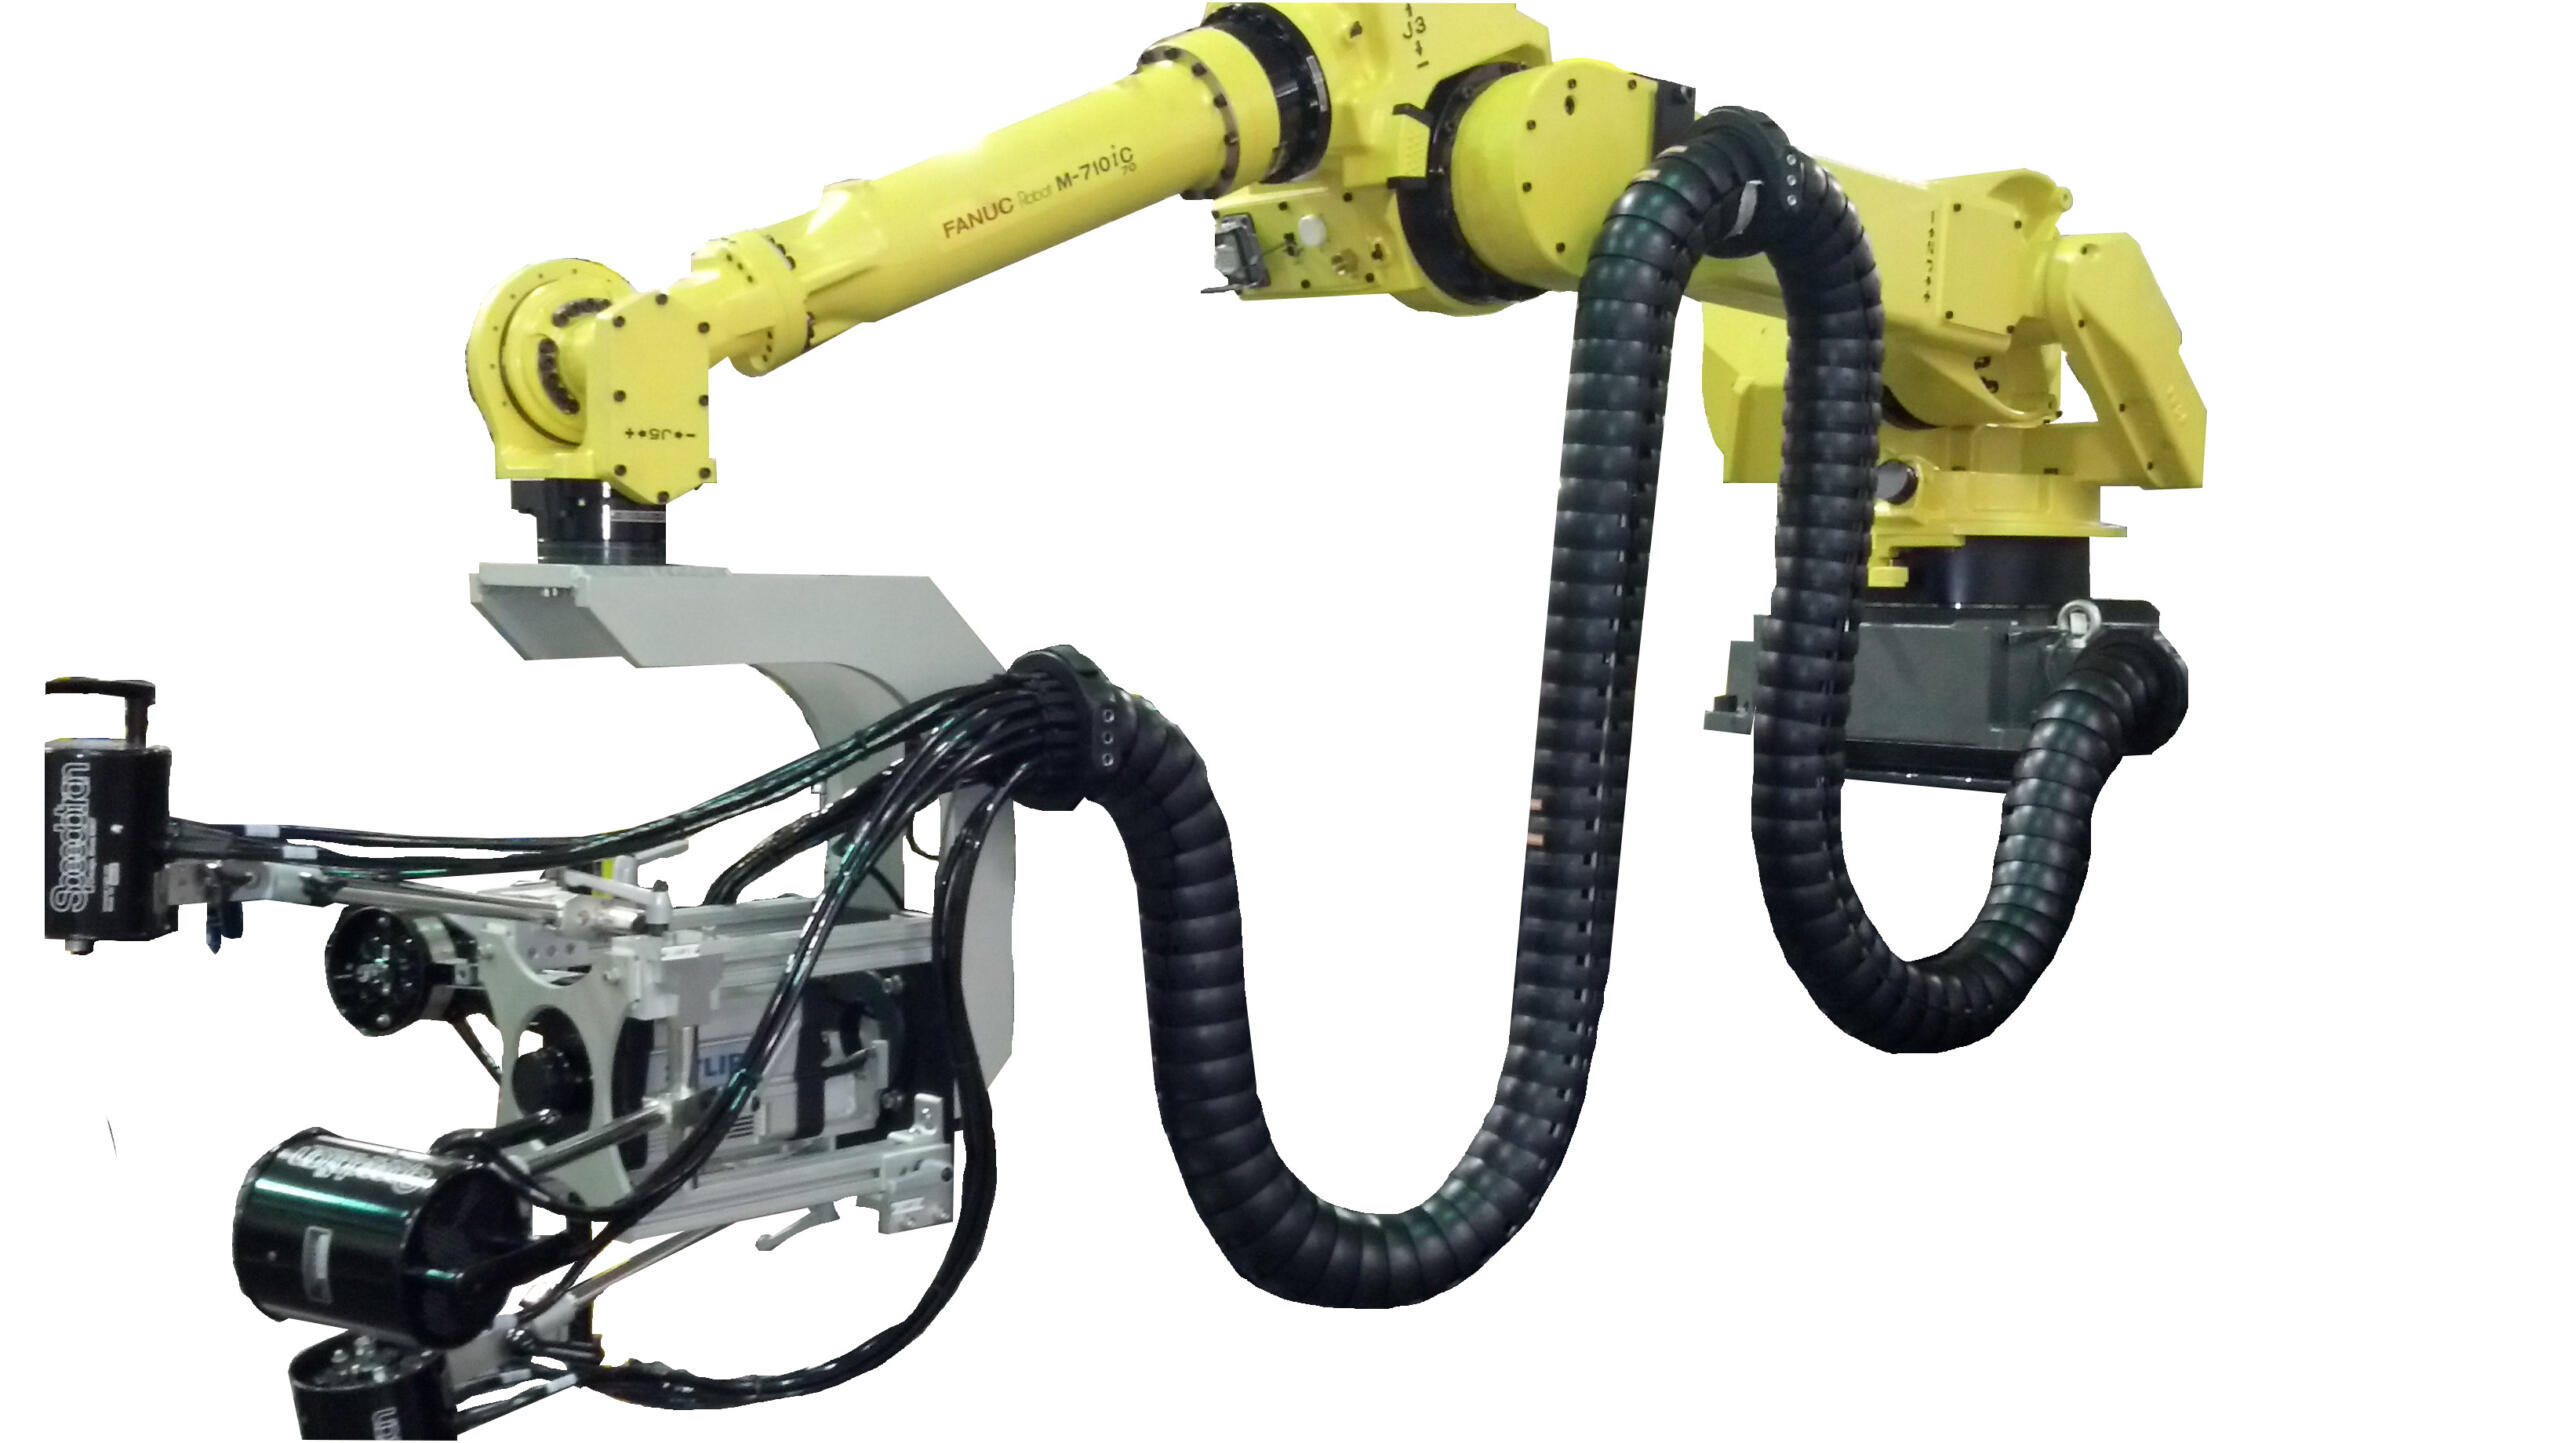
Collaborating with our client, we created a manufacturing inspection system that uses an IR camera and a robot to scan different regions on the blade under inspection. The camera is placed at specific locations and at various viewing orientations to fully inspect all the holes in the blade.
A PC running a LabVIEW test application manages the entire process. Safeties and control of access to the part under inspection are included to protect personnel and product. The system uses hardware sensors and switches and some via FPGA I/O to accomplish this safety monitoring.
Working with our client and our machine builder subcontractor, we helped select the NI hardware best suited for this test system. Our primary focus was on the interface between the IR camera and the system safeties.
Benefits
- The reliability, reproducibility, and speed of the automated inspection augments the operator capabilities
- Improved part quality of parts released to downstream production steps.
- The measurements collected during inspection of each part are available for quantitative analysis of the performance of the manufacturing processes. This post-inspection information helps improve quality all around.
Working Together
This project was the culmination of over 10 years of development effort between our client and Viewpoint engineers.
We started with a basic R&D proof of concept system.
After some tweaks to the process and associated system redesign, we were ready to use a prototype system in a trial run situation where manufactured parts were run manually. This stage gave confidence to those in manufacturing that the system would improve part inspection while speeding up the original manual inspection process. Some changes were made at this stage to decrease costs and improve the test engineer and operator interfaces. It was then placed into the production environment.
Along this entire multi-year development path, the level of automation was increased and the system design was adjusted as we learned from each other about what worked and what didn’t. For example, early in the R&D phase, attention was paid to the analysis algorithms and data required to make those reliable and accurate. And, for the production phase, we changed hardware components to make the test stand hardware less expensive and more robust while reworking the user interface of the software application to be simpler to configure and run.
Both Viewpoint and our client formed a tight team during this journey, with one constant being the Viewpoint engineers involved as the various people on the client’s side changed as this inspection system moved through departments and physical location within our client’s facilities, eventually culminating as a complete test rig with a robot, test stand for data acquisition control, and safety components to protect the operator.
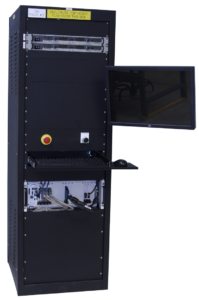
System Overview
The system is composed of the following items:
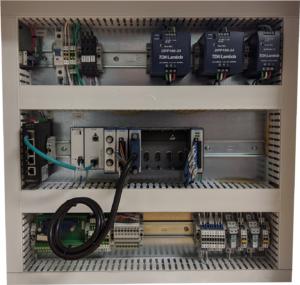
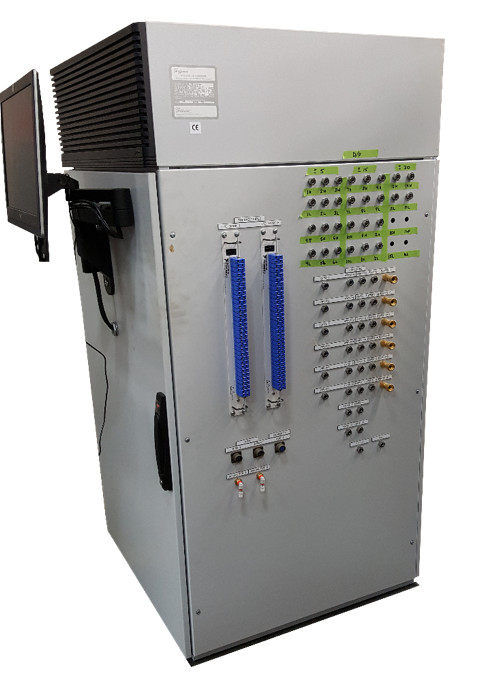
- Test stand and control hardware cabinet
- LabVIEW test application running on a PC
- Robot and motion controller
- Vision system for IR camera
- NI Compact RIO FPGA digital I/O for controls and safeties
- NI Compact RIO analog I/O for equipment status
- Hardwired safeties and switches for operator and equipment protection
The LabVIEW application manages the entire inspection cycle:
- Assuring a part is present in the nest before starting the inspection process,
- Downloading the part-specific motion profile to the robot,
- Acquiring the images from the IR camera,
- Analyzing the images,
- Compiling the results, and
- Preparing a test report for the part.
Simultaneous with this cycle, the application checks digital and analog I/O for machine status and errors.
If a part model has not been inspected before, the LabVIEW application is used to create the motion profile for that part model.
When the test on a specific part is started, that motion profile is downloaded to the motion controller based on the part type as selected in the application.
After testing a part, the operator is presented with the test results where the option to accept, retest, or reject is offered. The operator is integral to this automated test. In any case, the test data is archived.
When the test is completed, the operator unloads the part for final disposition and loads the next part to inspect.
The LabVIEW application also has a diagnostic mode and configuration editor which is used by the operator or manufacturing engineer to evaluate and tune the inspection process.
The robot movement is managed by a motion controller based on the motion profile created via the LabVIEW application. The PC-based image acquisition is done when the motion controller alerts the LabVIEW application that the part is oriented and positioned within the field of view of the camera. Images are acquired for each of the positions defined in the motion profile.
Safety for both the operator and the part is handled in two ways. First, the Compact RIO FPGA checks system status via digital and analog inputs. Second, hardwired safety sensors and switches assure that the operator is out of the way when the robot starts moving and that the part is in the nest ready for inspection. An example of these “hard” sensors is a light curtain which will cause the system to stop if the curtain is affected during a test.
| SOFTWARE FUNCTIONS |
|---|
| NI FPGA for control and safeties |
| PC LabVIEW test application |
| System configuration |
| Data management |
| Safeties and machine status |
| HARDWARE USED |
|---|
| Articulated robot |
| Vision camera |
| FPGA digital I/O |
| FPGA analog I/O |
| Hardwired safety circuit for personnel and product protection |
| Touchscreen monitor |
Enhancing an existing test system for ease of maintenance
Enhancing an existing test system for ease of maintenance
Reduction of time and frustration motivates software upgrade of a capable but inflexible test system
Client – A world-wide manufacturer of refrigeration units
Challenge
Our client had been using a 15-year old test system LabVIEW-based application that was becoming difficult to update. Plus, the designs of their newest refrigeration units were more complex than ever, requiring new test steps.
On top of that, our client wanted to give the operator flexibility in sequencing the test steps. For example:
- the operator might want to run a specific test twice to verify operation,
- the operator might want to restart a sequence in the middle after reworking a part, or
- the test engineer might want to add another test step to further clarify operational data for historical trend analysis.
The existing application was based on a state machine architecture. While state machines can be edited to handle different sequence flows, this test application had numerous alterations over the past 15+ years to support the needs for testing new product designs. These amendments compounded over the years into an unwieldy test application.
New products were about to be introduced which would require additional modifications to the existing state machine and subsequent verification that:
- changes worked as planned and
- changes didn’t affect any other existing modes of operation. This need was increasingly daunting.
The Design and Development Process
Very early in discussions, we showed our client a test application based on an object-oriented (OO) software architecture, and its associated user interface, that we had used in previous test system projects for other clients. We thought it might satisfy some of the desires we were hearing about:
- how the older state-machine-based test system was difficult to maintain,
- how some users were frustrated by the inflexibility of the test sequencer, and
- wondering why the system can’t be easier to update for new product requirements.
Moving the existing application over to this new architecture would clearly require more effort than another patch, so we had to decide if the cost for this approach would be justified based on two major benefits:
- Simplify the management and verification of future changes.
- Enable flexible test flows to give the test operator a better user experience.
Both benefits would accumulate cost savings for maintenance and upgrades going forward. After discussions with our client, we jointly decided this approach was justified.
After reviewing this OO approach, our client asked us to use it to develop a small test system for another component of the refrigerator products. This small system gave our client the chance to explore the “look and feel” of this new architecture and user interface design before embarking on the test system discussed in this case study.
That trial project was a success, and we were given the go-ahead. The benefits, as described above, were clear.
After the development was complete, we:
- worked with our client on integrating the test system into the existing test station,
- performed acceptance testing, and
- delivered the final items, like source code, to our client.
Solution
The initial upgrade tasks in creating this new application started by identifying the code for the test steps in the existing test application, which was based on that state-machine architecture, and then rewriting the test step functionality with the OO methodologies discussed earlier.
We also reworked the sequencing of steps to use an OO-based test sequencer. The test sequencer was reused from some of our prior projects.
For each test step in the existing test application, we repurposed the existing LabVIEW code in two ways:
- First, we identified code functionalities that were commonly used throughout the state machine for the purpose of defining a set of reusable step types.
- Second, we converted that common functionality into LabVIEW classes via copy-paste into the class methods, coupled with extraction of the configuration parameters needed to give each class the behavior needed for a particular step.
For example, the existing state machine contained many steps that provided a request-response method over a data bus. These similar steps were corralled into a single class with methods for data communication. Thus, each of the multiple original states in the existing application which requested parameter values could be made by calls to the same class in the new application simply by providing specific configuration inputs to the same class method.
Benefits
This OO design simplified updates to the test steps and their sequencing.
Furthermore, the operator interface was simpler, cleaner, and allowed the operator to manage the flow of the test steps. For example, operators could jump around in the test sequence when needed, say for reviewing the occasional confusing result or helping to develop the production test sequence.
The OO design of this new test system application was aimed squarely at improving the user experiences of both the operator and test engineer. Secondarily, the OO design will help the test system developer by untangling the original state machine code into supportable, extensible, and maintainable software.
Some specific benefits available from this new OO design:
- Reduced frustration – If the operator noted something confusing about the outcome of a test step, that step can be rerun without needing to restart the entire test sequence.
- Improved operational efficiency – The operator and/or test engineer can try a different sequence of test steps for operational or efficiency improvement.
- Faster test system updates – Two aspects make updates faster and cleaner. First, new product designs can be accommodated with less worry about whether the fragile state machine code will break, Second, the code modularity of OO test steps makes it easier to implement new tests.
These usability and maintainability features will save our client cost and schedule in future product upgrades as well as highlight the contributions of the test system on production efficiency.
System Overview
The test hardware was based on NI CompactDAQ and the application was written in LabVIEW. The automated test system provided the following main features:
- Test configuration based on the type of part being tested
- Test sequencing with part-specific test steps
- Test sequence execution can be managed by the operator in real-time
- Display of test results as the sequence progresses
- Archiving of test data for historical tracking
The test flow that this application runs is:
- The operator enters the model and serial numbers (typed in or scanned in).
- The test system looks up the model number and finds the test sequence to run.
- The test system populates the sequencer screen with the appropriate test sequence.
- The operator can select a step from which to start or just click the Start Test button to begin the entire sequence.
- Buttons at the bottom of the sequence display allow the user to Pause, Abort, or Resume the sequence.
- Executed test steps are highlighted in green (pass) or red (fail) to indicate how the sequence is progressing. The operator can scroll through the test sequence to review the outcome of each step.
- If the sequence is configured to do so, the sequence may pause at a failed step so the operator can repair and retest that step.
The unit under test (UUT) was monitored by the test system to view sensors both internal and external to the UUT. The external sensors are used to detect the environment of the unit, such as being in position, connected to power, and so on.
Besides a few thermocouples and digital inputs, measurement data used to determine pass/fail was obtained from the UUT via the data bus.
All these inputs were handled by a set of NI modules in a 4-Slot cDAQ chassis.
| SOFTWARE FUNCTIONS |
|---|
| Data communications |
| Acquire sensor data |
| Control digital output |
| Acquire digital inputs |
| Test sequence management and execution |
| Archiving of all test results |
| HARDWARE USED |
|---|
| 1 Port High Speed Communication Module |
| 8 Channel AI Module |
| 8 Channel Sourcing DO Module |
| 8 Channel Sinking DI Module |
Updating an obsolete LabVIEW-based system for measuring solar irradiance
Updating an obsolete LabVIEW-based system for measuring solar irradiance
Maintaining continuity between old and new systems was important for correlation with nearly 40 years of historical data

Client – California State University at Northridge (CSUN)
Challenge
Our client had over 4 decades of data on solar irradiance (the amount of light our sun emits). Over that decades-long time span, equipment suffers breakdowns and needs repair or replacement. We were called in to replace that old system with an upgraded system.
For this obsolescence upgrade, the solar irradiance measurements, before and after the equipment change-over, must compare to provide continuity in the measurements.
Consequently, our replacement system had to be checked against the existing system before it went completely defunct.
To that end, we needed to continue making the light measurements with the existing linescan photodiode array. This linescan device required some low-level digital signal control and handshaking to initialize and perform the measurement data collection.
Solution
The prior system used obsolete hardware from National Instruments (NI) such as an E-Series card multifunction data acquisition card and a TIO-10 timer-counter card.
Beside being obsolete, this hardware used on old computer bus. The combination of these defunct features was addressed with a new PC and data acquisition hardware.
Furthermore, some support components were also needing upgrade, such as a non-functional power supply.
We also upgraded a circa 2013 LabVIEW application and added some new functionality. Luckily, the CSUN team had the source code.
All these components were delivered as a turnkey system to CSUN.
Benefits
Obsolete measurement system update – enabled essentially unbroken measurements of solar irradiance over the nearly 40 years coupled with some overlapping data collection for comparison of previous and present data gave confidence that the upgraded system could continue to collect important solar irradiance data for many years to come.
The sun’s output does vary cyclically about +/- 0.035% on average following the sunspot cycles about every 11 years. Check out the plot of solar output over the past about 25 years in this link: https://spacemath.gsfc.nasa.gov/sun/Earth8.pdf
How we worked together
CSUN researchers connected with us after they reviewed our capabilities on our website and had a subsequent conversation. Although the CSUN team had a very good technical understanding of the required upgrades, they were not experts in automation systems and were looking for a system integrator for help.
From our perspective, all the details about the operation of the existing system would be in the LabVIEW source code and electric / signal system schematics. As mentioned earlier, CSUN did have the source code. Some older schematics needed a bit more digging by us to identify all the relevant hardware.
Our proposal was based on this system information and one or two clarifying discussions. CSUN accepted and funded our proposal and we began the upgrade effort.
We didn’t have access to some parts of the system, such as the linescan array, so we tested the completed upgrade as much as we could at Viewpoint and then scheduled a trip to CSUN for the final installation and commissioning.
Once on-site at CSUN, the only surprise was a power supply that wasn’t functioning as expected. CSUN replaced that unit while we were on-site. After all the upgraded components were in place, the system was tested and commissioning was completed successfully.
System Overview
CSUN uses two Cartesian Full Disk Telescopes (CFDTs) to measure solar irradiance. These telescopes can measure irradiance at various specific wavelengths of light. Measurements are made daily and compared with space-based measurements.
Specifically, comparisons are made between irradiance measurements obtained from instrumentation on the SORCE satellite with the measurements obtained from CSUN’s ground telescope-based measurements. The space- and ground-based equipment measure different ranges of light wavelengths. The SORCE measurements span a wide range of wavelengths. This satellite was launched in early 2003 and its mission was completed in early 2020 (https://lasp.colorado.edu/sorce/). Note that SORCE measurements do not have to contend with Earth’s atmosphere.
The CSUN equipment measures at a few specific wavelengths. Comparisons between the two methods is important because satellites don’t last forever, necessitating ground-based equipment that is confirmed from space-based measurements. And, of course, ground-based measurements must contend with Earth’s atmosphere, so correction factors must be calculated and confirmed. Assessing the validity of long-terms trends against shorter-term space-based data lends assurance to ground-based equipment measurement. The nearly 40-years of continuous CSUN measurements can proceed into the future with confidence.
The system we deployed replaced the obsolete equipment and software with:
- new measurement hardware,
- a workstation,
- and a failed power supply.
The application software was upgraded as well to:
- bring it up to the current LabVIEW version,
- add some new functionality,
- and Interface the linescan imager with the upgraded USB-based measurement hardware from NI.
| SOFTWARE FUNCTIONS |
|---|
| FITS image creation |
| Control of linescan array |
| Updated application with improved user interface |
| HARDWARE USED |
|---|
| Dell Workstation |
| NI USB Multifunction module |
| Cables, BNC breakout panel, power supplies |
Automated production test of EO/IR imaging subsystem
Automated production test of EO/IR imaging subsystem
Assessing quality of mission-critical electronics for imaging
Increased throughput by automated signal skew adjustment and pixel verification
Client – Worldwide supplier of products for aerospace and defense
Challenge
Our client wanted a test system that would significantly increase production rates for a very specialized focal plane array (FPA) and associated readout integrated circuit (ROIC) electronics.
In broad strokes, the system needed to support the following:
- Increase production test throughput as much as reasonably possible within budget and schedule constraints.
- Provide some low-code or no-code way to create new test protocols.
- Protect the DUT using hardware and software interlocks.
- Verify the correctness of test image(s) and all its pixels.
Solution
The FPA and ROIC testing for this client used many of the same techniques we have implemented for FPA/ROIC testers at some of our other clients. Thus, the solution was built around our AEDIS platform and some custom connectivity hardware which paired the DUT to the AEDIS hardware.
Specifically, the test needed to:
- Send digital signals from the AEDIS hardware to initiate and coordinate the test steps.
- De-skew bitstreams from the DUT.
- Organize and rearrange the bitstreams into image pixels.
- Provide custom “personality” modules to connect the DUT and AEDIS hardware.
- Protect the DUT from connection and power faults.
Benefits
All the bulleted items above are common requests from our clients and are supplied with the AEDIS platform or easily accommodated by design of the platform. Consequently, AEDIS often meets 80% or even 90% of typical client needs.
Thus, the client was able to cost-justify an AEDIS-based solution for two main reasons:
- overall system costs for an AEDIS-based solution were significantly less than a completely custom system and
- the increased production rates provided plenty of schedule buyback.
Furthermore, the script-based, low-code capabilities offered by AEDIS enabled:
- Support of different test images.
- Control of image transfer initiation, handling responses from the DUT, and flow.
- Version control (by the client) of script-based test configurations.
- Defined parsing of bitstreams to create the image pixels to simplify downstream image collection.
System Overview
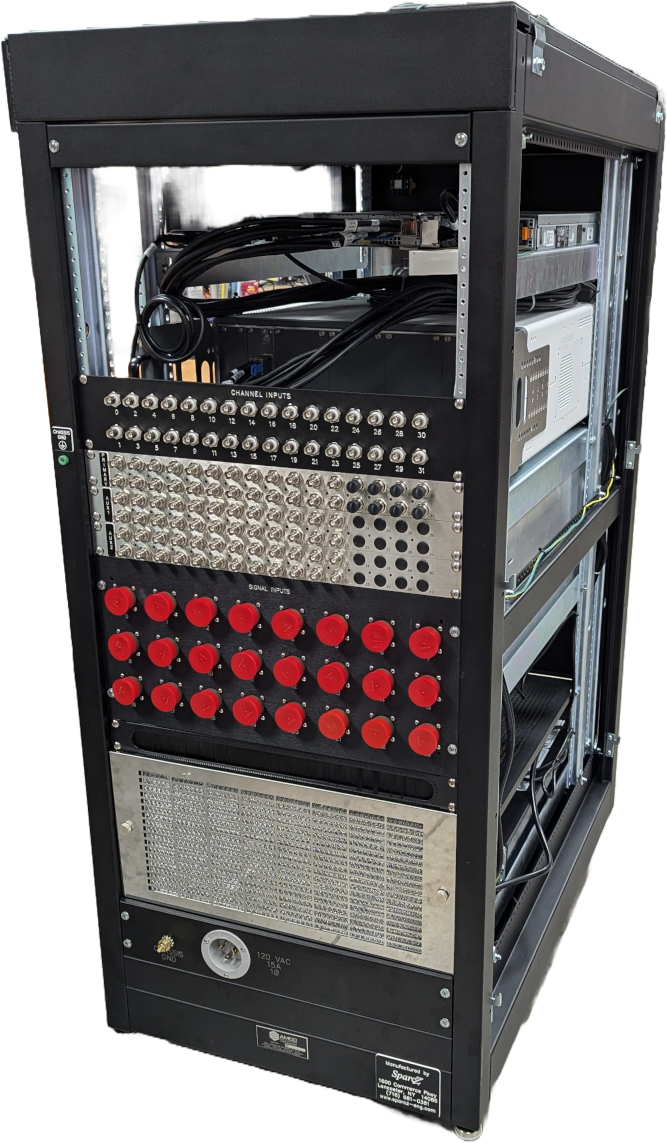
The test system was built around AEDIS, which is a combination of five major components:
- NI FlexRIO PXI modules and chassis.
- Signal conditioning hardware.
- A REST API interface for the client’s test sequencer and LabVIEW FPGA for the hardware interfacing.
- An out-of-the-box browser-based app to interact with the AEDIS system.
- A source measure unit to supply and test the DUT’s power needs.
With this design, AEDIS acts as an instrument to incorporate into the client’s overall test system.
The NI FlexRIO modules use Xilinx FPGAs for digital I/O at the rates and channel counts required to fully test the FPA on the DUT. Some digital lines were used for commands to the FPA while most were used to receive output from the FPA.
The AEDIS interfacing hardware acts as an ITA while converting the FPA/ROIC signals to types expected by the FlexRIO. A custom “personality” module provides the physical connectivity from the client’s hardware cabling to the ITA. The AEDIS software handles the test configuration setup, data acquisition, and data storage via high-speed RAID drives.
During development of the test system, AEDIS hardware and software were also used to emulate the actual FPA and electronics to verify, before deployment, that the test system was working as required. This same setup can also be used for periodic verification as might be needed for an annual equipment performance audit.
Finally, configuration files were built from user-created scripts to give the client flexibility for adding new test capabilities for the DUT.
Some of the significant hardware and software challenges mitigated by this combination of PXI FlexRIO and AEDIS are:
- Interface to tester: The AEDIS system is treated as an instrument managed by an overall test system. The client developed some custom C# code to interface to the AEDIS REST API interface to automate their test procedures.
- DUT interfacing: Standard (keyed) cabling ran between the DUT and the custom AEDIS “personality” card to match cabling to the DUT. The output of this personality module went to the AEDIS LVDS modules.
- Channel skew: The high-frequency digital LVDS signals from the DUT can develop noticeable timing skews between channels upon arrival at the FlexRIO inputs due to signal path length differences. The test system had to detect and accommodate for these skews before combining the bits streams into bytes, then pixels, then an image.
- High data rates: Not only were the digital data output at high frequency but many channels were needed to accommodate the full frame rate of the DUT. The FPGA and the PXI backplane needed enough processing and transport bandwidth to accommodate the throughput.
- Interlocks: Keyed cabling and “signal present” software checks assured proper connections between the DUT and the AEDIS hardware before testing would begin. These safety checks were justified due to the high cost of each DUT.
- User-defined scripts: Scripts created and edited by the user provided flexibility to address future test types and system obsolescence. For example, the scripts defined details such as a) the DUT-specific commands (some of which could not be shared with us for secrecy reasons), b) when the image is being captured (or ignored), and c) if the image is stored to disk or RAM.
| SOFTWARE FUNCTIONS |
|---|
| Browser-based app for manual operation and recipe creation and editing |
| REST API interface for support of automated operation |
| Configuration of the test via scripts |
| Pre-test interlock checks |
| Data collection, bit stream processing, and mapping digital bitstream to pixels |
| HARDWARE USED |
|---|
| Standard AEDIS components for signal buffering, conditioning, and signal acquisition |
| Custom personality hardware for connectivity and physical connection interlocks |
| Signal test points in AEDIS breakout ITA modules enabled use of a logic analyzer for troubleshooting and further verification |
Automated Measurement System – Verifying Flow Rate Performance in a Medical Device
Automated Measurement System – Verifying Flow Rate Performance in a Medical Device
Assessing quality and managing traceability of a medical device
Automation increases throughput by testing multiple units independently
Client
Worldwide supplier of products for surgery
Challenge
Our client wanted to perform detailed quality checks on the performance of some of their fluid dispensing products. These products dispense fluid over long periods of time (hours) so rigorous testing of each unit in production would take too long. But, being medical devices, these products need to follow ISO 28620 standards and FDA 21 CFR Part 820 regulations, so a rigorous test process is helpful to fulfill these needs. The automated test system below is part of that overall fulfilment.
The client came to Viewpoint with the following high-level desires for a system to test the product:
- Support independent configuration and testing for up to 6 units.
- Simplify overall test setup by copying the configuration from one unit to another.
- Handle different volume amounts supported by assorted models.
- Measure from each unit the weight of fluid dispensed as a function of time. (Weight was converted to volume using the fluid density.)
- Compute the “instantaneous” flow rate (volume vs time) as the test progresses.
- Keep track of the calibration status of the weight scales at each of the 6 positions in the test system.
- Enable some measurements to be excluded at the start and end of the run for calculations of average flow rate.
- Provide graphs and metrics of results to enable faster review of the data during the test.
- Add ability to comment on each unit while testing is in progress, and after, and track these for compliance.
- Print (PDF) a report on each unit’s results along with its identifying info, such as subcomponent lot numbers, the test datetime stamp, and the operator’s ID.
Solution
The client had an initial version of the testing application which they developed for testing their various initial design iterations. Viewpoint enhanced this existing application with the features listed above. The motivations for this enhancement were to:
- Automate testing of the initial production units more thoroughly than the existing application allowed.
- Enhance the user experience for easier testing.
A major aspect of the user experience was to support testing of multiple units independently from each other so that unit testing on one device could start/stop while other devices were installed in (or removed from) the tester without interrupting tests on other units.
- This need was especially important since some models might take twice as long to test as other models or the setup of one unit might need additional adjustments before starting. This meant that starting and stopping all at the same time could reduce utilization of the tester, and it made sense to have independent and parallel operation.
- Furthermore, with parallel testing, the tester was not constrained to having a full set of units to begin testing operation, since the tester could run with only 1 unit installed.
The other major enhancements focused on the user experience by offering real-time data of a particular unit’s testing, as well as real-time graphs to show progress. These graphs were useful because the operator could clearly see when a unit was not performing as expected and the test for that unit could be aborted without affecting testing on the other units.
Since this testing needs to follow the requirements in the ISO 28620 standard and 21 CFR Part 820, it was important for the application to be aware of the calibration status of each of the 6 weight scales, one for each position in the test system.
Benefits
The main goal of this project was to augment the test operator’s ability to set up the testing of products while providing real-time visual feedback to the operator about the testing status.
Some of the benefits of this automated test system were:
- The test automation provided consistency resulting from the software-enforced test process.
- Test status via the visual feedback helped increase the efficiency of the operator.
- Enhance the user experience for easier testing.
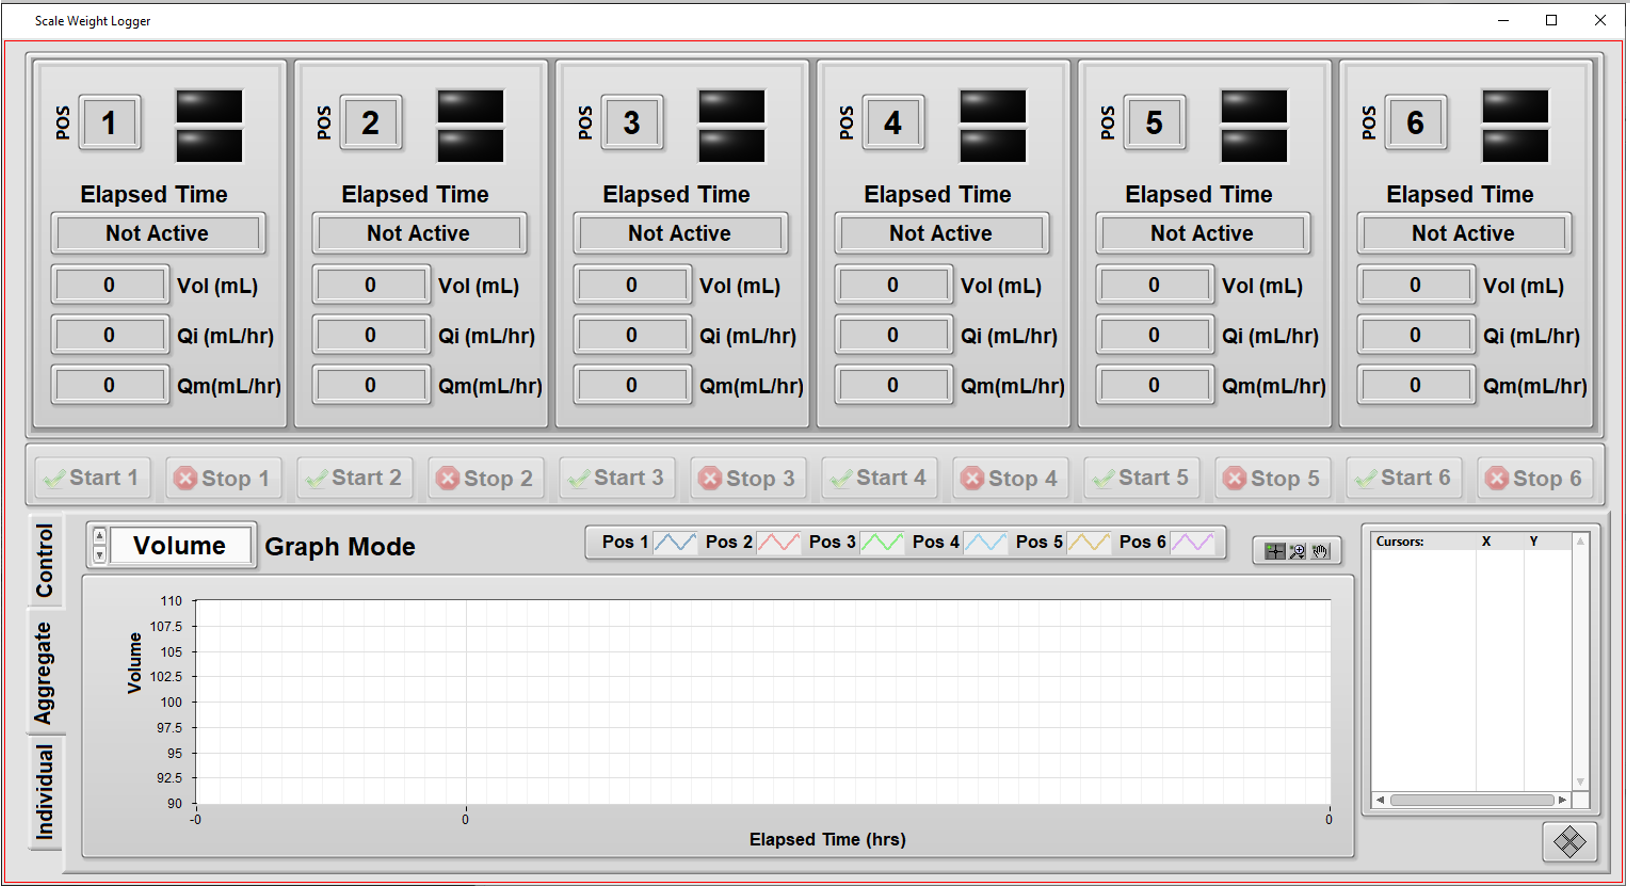
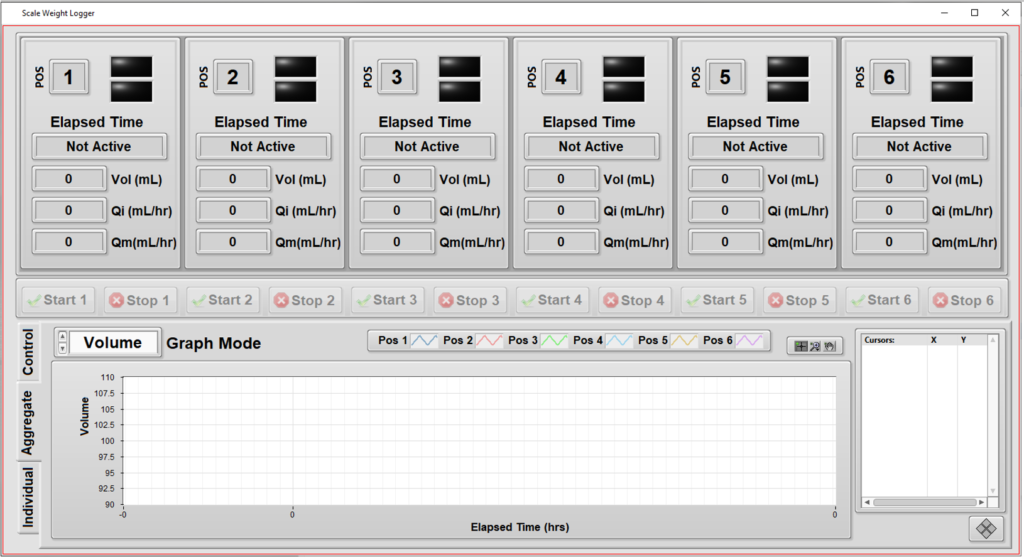
System Overview
The application was developed in LabVIEW and measurements were made via RS-232 communications to each of the 6 weight scales. Once a unit was installed in the tester and the operator started the test on that unit, the application:
- tared that unit’s scale,
- started the flow,
- and collected weight measurements frequently to build a curve of “instantaneous” flow versus time.
These “instantaneous” flow numbers were used to compute statistics such as maximum flow and average flow over the course of the entire test run.
Some of the primary functionality of this system includes:
- Independent tests: testing a specific unit doesn’t interfere with testing of others.
- Graphs of flow rate during the test execution: visualize the unit’s performance during the hours-long test time, not just at the end.
- Calibration check: the next calibration date of each of the weight scales are maintained in a configuration file, so the operator can check that the test system is ready to run a test at a particular position.
- Different volumes: since each unit is tested independently, the system can handle different volumes for each position in the tester.
- Enhanced commenting: operators can enter comments about each unit (or all of them) and have these comments archived for compliance purposes.
| SOFTWARE FUNCTIONS |
|---|
| Logging of weight versus time for up to 6 test positions via RS-232 communications to scales. |
| Manage the configuration and commenting of the test. |
| Save, recall, and copy configuration information to ease the operator’s setup effort and time. |
| Display graphically the curves of flow versus time while the test progresses. |
| Compute statistics on the flow after test completion. |
| HARDWARE USED |
|---|
| Multiport ethernet to RS-232 serial communications. |

Custom Automated Test System – Quantifying Energy and Durability Performance for Refrigeration

Custom Automated Test System – Quantifying Energy and Durability Performance for Refrigeration
Automation reduces manual labor while improving traceability
Assessing performance for improved energy ratings and longevity
Client – Zero Zone – Commercial refrigeration systems manufacturer
Challenge
Zero Zone wanted to improve the capabilities and durability of their new reach-in refrigeration products.
You might think that refrigeration is a mundane product line, but that is just not true! So many innovations are occurring as manufacturers are redesigning their products to improve their environmental footprint through better energy efficiency, coolants, and durability.
Assessment requires an understanding of the performance of the refrigeration units under many conditions. Zero Zone was taking measurements with a datalogger with too few channels, and no synchronization, to other devices that feed into the system. Plus, they had multiple models of their reach-in refrigerators that needed to be assessed. Furthermore, simplifying the data collection and analysis would make it easier to validate against ASHRAE standards.
Zero Zone came to Viewpoint with the following high-level desires:
- Expand the measurements by adding more channels and channel types (e.g., 4-20 mA, ±10 VDC and digital I/O).
- Provide graphs and KPIs to enable faster analysis of the data during the test.
- Minimize the chance of data loss during long test runs.
- Synchronize data collection and actuation.
- Automate storage of measurements per a user-defined period to eliminate manual start/stop of data collection.
- Simplify the manual configuration setup.
- Enable a way to find relevant data perhaps months or years after the test run.
Solution
Viewpoint developed a monitoring and control durability test system that could exercise Zero Zone’s refrigerators through hundreds of operation cycles over multiple conditions to simulate actual usage in, for example, a grocery store.
During initial conversations, we collaborated closely with Zero Zone to brainstorm on some potential approaches. We made some suggestions that could satisfy their desires while also managing their time and cost budgets. Part of that process involved helping Zero Zone in the selection of the cSeries modules, to assure the most effective modules balancing cost per channel, connectivity, and anticipating some possible future needs.
As an example, by automatically populating the cells in an Excel template based on their original systems’ Excel spreadsheet, we provided streamlined report generation without having to rewrite all the calculation code embedded in their Excel file in another app. The compromises we jointly endorsed were:
- Run an app on a PC to configure and monitor the test.
- Use both NI Compact RIO and Compact DAQ to enable robust and synchronized data collection and control with the ability to expand channels by adding modules in both the cRIO and cDAQ chassis.
- Store data on a local PC rather than a remote server to minimize the probability of data lost during the test run.
- Save configurations into Excel files for recall, and cloning, of prior setups.
- Write measurements automatically into the same Excel file for archive of the test setup and measurements.
- Create, in this same Excel file through cell formulas, the summary report from the summary calculations. This approach allowed flexibility for changes to internal and external test standards.
- Upload the summary data and test reference info into a SQL database for data management and long-term test statistics.
Digital outputs (DOs) were used to control various aspects of the test, such as door open/close and defrost on/off cycles. For flexibility, the user can specify the sequencing of these DO channels, in the Excel file used for the test, with various parameters that define the duty cycle, period, number of cycles, and start delay. The timing of these DO state changes was synchronized to the data acquisition by the real-time loop in the cRIO.
This system was deployed to 6 test bays, each one of which might be testing a unit for as little as a few weeks or as much as a few months.
Benefits
The main goal of this project was to reduce the effort and associated human error in the design and execution of the test run.
Some of the primary benefits for this automated system were:
- Reduced Errors: pre-verified template files used for test configuration and data storage lent consistency to test setup and execution.
- Less Testing Time and Effort: the automatic execution of the test and storage of measurements enabled running tests for multiple days (and nights) without technician interaction. Technicians could work on setting up other units for test rather than babysit the existing test. On average, based on the duration of the test time, testing throughput increased by approximately 25% to 40%.
- Shorter Reporting Time and Effort: reports were available about 85% faster than the time previously spent creating manually. The quicker feedback saved costs through early detection of unit problems and faster teardown at the end.
Some additional major benefits were:
- More details on refrigerator operation: “Wow! We never saw that before.”
- Database consolidation: statistical analysis takes hours not days and includes all tests run in the lab, not just ASHRAE tests. This central database enables long term retrieval of all test data.
- Reuse: techs embraced ability to reuse and modify previous setups.
- Consistency: driving the test definition through an Excel file encouraged uniformity.
- Traceability: documented and timestamped calibration measurements.
- Flexibility: channel counts, acquisition modules configuration, calibration, and calculation formulas were straightforward to change for new test setups.
The test automation provided by this system greatly reduced the labor involved in configuring, running, and analyzing the test run. Furthermore, the customer benefited from the consistency that resulted from the software-enforced process.
System Overview
We developed the application in LabVIEW and LabVIEW RT combined with a cRIO connected to a cDAQ via TSN Ethernet.
The data acquisition modules slotted into the cRIO and cDAQ chassis handled the I/O to the customer sensors and actuators. The sensors mostly measured:
- temperature,
- pressure,
- flow,
- power, and
- voltage.
| SOFTWARE FUNCTIONS |
|---|
| Data logging of between 50 and 150 channels and control via digital signals |
| Interface with Excel files for configuration, data logging, and summary calculations |
| SQL database for summary and test setup data |
| Real-time loop for robust operation |
| HARDWARE USED |
|---|
| NI cRIO 8-slot chassis, TSN enabled |
| NI cDAQ 8-slot chassis, TSN enabled |
| Various NI cSeries signal conditioning modules |
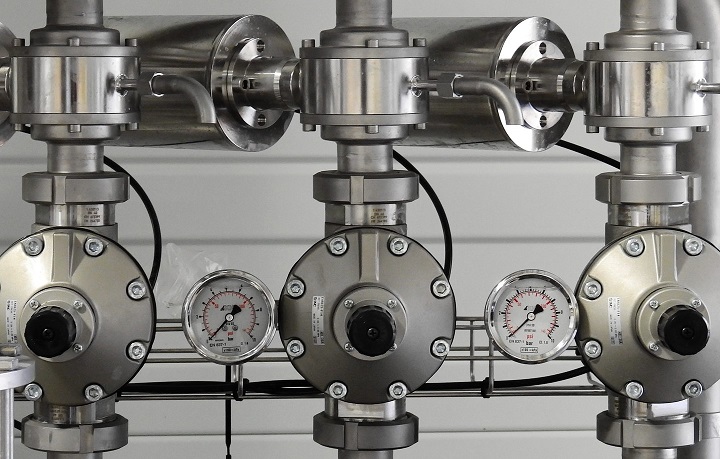
Custom Automated Test System – Characterization of Heat Transfer System Thermal Performance
Custom Automated Test System – Characterization of Heat Transfer System Thermal Performance
R&D testing required flexibility in control schemes and measurement I/O
Client – ATSI, a large-scale System Engineering Provider
Challenge
Our client, ATSI, Inc., headquartered in Amherst NY, designs and builds complex structures and process systems, from industrial construction projects to mechanical systems for power engineering. A previous, long-standing Viewpoint customer that does research and design of thermal energy systems approached ATSI to engage in the build of a specialized test skid that would be used to assess and characterize a heat transfer system. Our long-standing end-customer requested a data acquisition subsystem based on LabVIEW.
Furthermore, the end-customer requested a subsystem that supported flexibility in the data acquisition by channel count and type, since the R&D nature necessitated adaptability. The overall test system needed to automate progress through a sequence of setpoints and ramps.
Solution
ATSI designed the automated control and sequencing with a Modicon PLC. Viewpoint augmented ATSI’s engineering resources to provide the data acquisition subsystem and setpoint sequence editing. This sequence was passed to the PLC for automated sequencing thought the setpoint list. Because our mutual end-customer did not provide explicit design details about the hardware needed for data collection and control, we had flexibility to decide which aspects of these needs would be automated by the Modicon PLC and which by the PC running LabVIEW.
Since Viewpoint had previously developed a similar application for our mutual end-customer, with some of the required data acquisition needs, we chose to leverage and enhance that software platform for this project. That choice drove some of the other designs and defined the scope of work for Viewpoint and ATSI. Specifically, we worked with ATSI to select NI hardware appropriate for sampling all the high-speed data, since the PLC would not be capable, and some of the slower speed data, which needed some specific signal conditioning. Other very-slowly changing process parameters were read from PLC tags.
Some overall design decisions were:
- The LabVIEW application provided data acquisition, test configuration, and operator screens.
- The Modicon-based subsystems provided process control and safety.
- A PLC HMI for process system operation and status as well as control loop tuning.
- NI Compact DAQ (cDAQ) offered flexible PC-based acquisition channels for high sample rate historical data collection.
- A sequence editor on the PC defined the test setpoints, durations, and limits to pass to the PLC for execution.
The test configuration encompassed cDAQ channel configuration, PLC tag configuration, sequence editing, and graphical views on the acquired data. Some channels were acquired at slow rates, e.g., up to about 1 S/s for sensors measuring parameters such as temperature and flow, while others had fast rates, e.g., 1 kS/s to 10s of kS/s for sensors measuring parameters such as transient pressure and vibration. Handling the datafile storage and display of this wide range of data types and rates was important for the end-customer to compare and correlate the effects of changing operating conditions.
Data logging is configured by the sequence editor to occur on certain conditions such as immediately entering a new step, time delayed after entering a step, and activated by the PLC upon reaching stable setpoint control. This flexibility gave the end-customer management of when data collection occurred to ease the comparison and correlation of readings from selected sensors.
After the configuration is completed, the sequence is passed to the PLC. The operator starts the test on the PLC HMI and the PLC automates the test run. Data collected during the test run could be displayed in live graphs during testing, used for verification of setup and operation; post-test in stacked graphs and overlaid plots; and exported for specialized analysis, display, and review.
Benefits
The design of this system was driven largely by the need for flexibility. Sensors and channels could be added, the test sequence could be edited with a variable number of steps with editable execution features, and the data acquisition and storage permitted various rates and logging criteria.
These design choices offered the following advantages:
- As a partner of the team, Viewpoint acted as staff augmentation for ATSI by providing experienced engineers with expert LabVIEW and data acquisition capabilities.
- Flexibility of test sequences, including setpoints and their stabilization criteria.
- Tight integration between the Modicon PLC and LabVIEW-based PC enables critical control and safety to execute reliably and yet adjustably.
- Customized mechanical all-welded skid plugs into end-customer’s test article.
- Setup of data logging including configurable sample rates.
- Ability to add channels by plugging in supplemental DAQmx-based cDAQ modules.
- The LabVIEW application architecture is actor-based for straightforward inclusion of new data sources as needed in the future.
- New data sources are registered with the object-based data aggregator.
- The system handles multiple days of test execution
- The multi-pronged viewer allows verification checks while in setup an operation as well as post-test review.
System Overview
The custom automated test system supplied to the end-customer was a hybrid, made up of PC-based and PLC-based components coupled with the fluid-handling components on the skid. The hardware listed below includes only the data acquisition, control, and safety items, and only a high-level description of the mechanical aspects.
| SOFTWARE FUNCTIONS |
|---|
| NI LabVIEW for Windows [Viewpoint] |
| NI LabVIEW Modbus driver [Viewpoint] |
| NI DAQmx hardware drivers [Viewpoint] |
| Actor-based object-oriented LabVIEW application for the PC [Viewpoint] |
| Modicon Concept software [ATSI] |
| Blue Open Studio HMI software [ATSI] |
| Function Block Programming for the PLC [ATSI] |
| HARDWARE USED |
|---|
| Modicon PLC and modules for pressure, temperature, flow and other process variables |
| NI Compact DAQ chassis and modules, e.g., 4-20 mA, RTD, thermocouple, thermistor, and 200 kS/s analog input |
| 600 VDC Power supplies |
| Components to flow fluid, including pumps, valves, pressure regulators |
| Intel Tower PC for LabVIEW |
| Mini Industrial PC for HMI |
Replacing Wire-wrap Boards with Software, FPGAs, and Custom Signal Conditioning
Replacing Wire-wrap Boards with Software, FPGAs, and Custom Signal Conditioning
Electronic components of fielded systems were aging out
Reverse engineering effort converted wire wrap boards to FPGA-based I/O
Client – Amentum – A supplier for Military Range System Support
Challenge
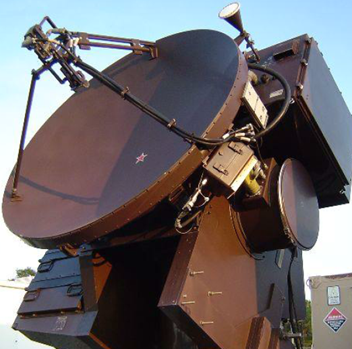
Amentum (www.amentum.com) supports a decades-old system deployed in the early 1980s. While the mechanical subsystems were still functioning, the wire-wrapped discrete logic and analog circuitry was having intermittent problems.
Systems designed and built decades ago can sometimes have wonderful documentation packets. Nevertheless, we’ve been burned too often when the docs don’t incorporate the latest redlines, last-minute changes, or other updates.
The replacement system needed to be a form-fit-function replacement to land in the same mounting locations as the original equipment with the same behavior and connections. Below is an image of the existing wire-wrap boards and their enclosure. We had to fit the new equipment in this same spot.
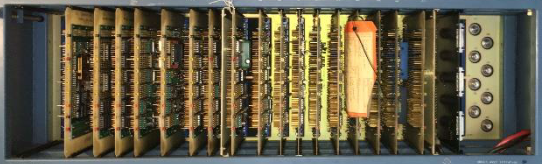
Figure 1 – Original wire-wrap boards
Finally, Amentum wanted to work with Viewpoint in a joint development approach. While our joint capabilities looked complementary, we didn’t know at the start how well we would mesh with our technical expertise and work culture – it turns out we worked extremely well together as a team and neither one alone could have easily delivered the solution.
Solution
Since the team treated the existing documentation package with suspicion, we adopted a “trust but verify” approach. We would use the documents to give overall direction, but we would need details from the signals to verify operation.
Leveraging Amentum’s experience with the fielded systems, the team decided early on to record actual signals to understand the real I/O behavior. We used the system’s “test verification” unit to run the system through some check out procedures normally run prior to system usage. This verification unit enabled us to use a logic analyzer for the I/O to and from the discrete logic digital signals and an oscilloscope and DMM for the analog signals. The available schematics were reviewed to assure that the signals made sense.
With a trustable understanding of system operation, Amentum created a requirements document. We jointly worked on the design of the new system. There were both an “inside” system (in a control shelter) and an “outside” system (in the unit’s pedestal).
Some overall tasks were:
- Viewpoint recommended an architecture for the inside application running on PXIe LabVIEW RT and FPGA layers.
- Amentum created the system control software on a Linux PC.
- Viewpoint developed the more intricate parts of the inside application and mentored Amentum on other parts they developed. This work recreated the existing discrete logic and analog I/O using PXIe NI FPGA boards.
- Viewpoint designed custom interposer boards to connect harnesses to the NI PXIe equipment, including a test point and backplane boards.
- Amentum designed and developed the cRIO-based outside system application and Viewpoint created a set of custom interposer boards to connect harnesses to the cSeries modules.
Critical to this project was our hardware selection services. By combining our engineering skills for the reverse engineering of the legacy electronics with our knowledge of the NI hardware, we narrowed the hardware choices to a few NI FPGA boards.
These PXIe FPGA boards and cRIO FPGA-backed modules handled the required 60 MHz clock-derived signals with correct phases, polarity, analog inputs, and so on. Furthermore, the wire-wrap boards were register-based so the PXIe had to decode “bus signals” sent over a Thunderbolt bus to emulate the programming and readouts from the various wire-wrap boards.
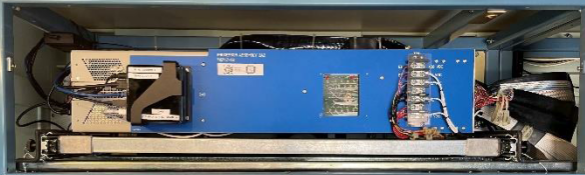
Figure 2 – PXIe replacement to wire-wrap boards
Amentum wanted to be able to support the LabVIEW FPGA VIs used to replace the functionality of the discrete logic. So, Viewpoint acted as mentor and code reviewer with Amentum to ramp them up on using LabVIEW FPGA effectively. Neither one of us alone would have been successful coding the applications in the allotted time. Joint knowledge and experience from both Viewpoint and Amentum were required.
Signal conditioning and harnesses needed to be reworked or replaced as well, of course, since the landing points for the wires were different in the new system. Viewpoint suggested a technique, which we’ve used frequently in past obsolescence upgrade projects, to create PCB boards that accepted existing connectors.
For the cRIO, these interposer “connection” PCBs plugged directly into the cRIO cSeries module. For the PXIe, these interposer PCBs accepted the field wiring connectors and converted them to COTS cables that connected to the PXIe modules. These interposer PCBs could have signal conditioning incorporated as needed. This approach significantly reduced the need for custom harnesses. All told, about 200 signals were passed between the PXIe and various other subsystems, and about 100 for the cRIO. This approach saved significant wiring labor and cost.
Figure 3 – cRIO with interposer boards between cSeries and field harnesses
The work to design and build the signal conditioning custom electronics was split between Viewpoint and Amentum. Viewpoint did more design than build and handed over the schematics and Gerber files to Amentum so they could manage the builds while also being able to make modifications to the boards as needed.
Benefits
Amentum wanted an engineering firm that was willing to work along side them as a partner. Joint discussions about architecture and design led to a collaborative development effort where Amentum benefited from Viewpoint’s extensive expertise and guidance on LabVIEW architectural implementation and FPGA coding style.
The main outcomes were:
- As a partner of the team, Viewpoint acted as staff augmentation by providing experienced engineers with technical capabilities that Amentum initially lacked.
- This team approach delivered a stronger product to the end-customer more quickly than either of us could do alone.
- The combination of Viewpoint’s and Amentum’s experience reduced the amount of reverse engineering needed due to the lack of firm requirements.
- Reduction of electronics obsolescence by using software-centric FPGA-based functionality. Recompiled LabVIEW FPGA could target future boards models.
- Increased software-based functionality simplifies future updates and modifications.
- Decrease in number of parts leading to simpler maintenance.
- Lower wattage consumed eliminated need for an anticipated HVAC upgrade.
- Cybersecurity concerns were reduced by using Linux-based systems and FPGA coding.
System Overview
Using software to emulate the old hardware was a critical success factor. Since the requirements were not 100% solid at the start of the project, some field-testing was required for final verification and validation. The flexibility of the software approach eased modifications and tweaks as development progressed. A hardware-only solution would have necessitated difficult and costly changes. For example, some of the changes occurred very near the final deployment after the system was finally connected to an actual unit in the field.
| SOFTWARE FUNCTIONS |
|---|
| Emulate original discrete logic functions via FPGAs |
| Emulate original analog signal I/O |
| Overall system control via Linux PC |
| Maintain the same user experience as existed before |
| Modern application architecture for simpler maintenance |
| HARDWARE USED |
|---|
| NI cRIO chassis with various cSeries modules |
| NI PXIe chassis with FPGA modules to handle all the analog and digital I/O via a combination of multifunction and digital-only cards |
| Custom PCBs for signal conditioning and connectivity |

Enhanced Portable Data Acquisition and Data Storage System
Enhanced Portable Data Acquisition and Data Storage System
Using a Real-Time Operating System (RTOS) provides a high level of synchronization and determinism for acquired data.

Client
Tier 1 Automotive Design and Manufacturing Supplier
Challenge
Our client had an existing data acquisition system, used for mechanical product validation testing, that had undergone many updates and patches for over 15 years. These updates and patches, performed by multiple developers, had rendered the software portion of the system somewhat unstable. Furthermore, the system hardware was based on NI SCXI, which was becoming obsolete. These issues prompted our client to migrate to an entirely new system.
New requirements for this upgrade included utilizing a PXI controller running NI Linux Real-Time, a RTOS, executing a LabVIEW RT application. Selection of the replacement NI hardware required knowledgeable engineering to assure compatibility between the selected NI hardware and the legacy SCXI equipment. Part of that compatibility assessment included an understanding of the software application so we could know for certain how the SCXI equipment was used. A blind selection based entirely on hardware specs would have missed nuance, such as the need for synchronized acquisition.
The data acquisition software had to support a variable mix of signal conditioning modules in the PXI chassis. In addition, the data acquired from these signal conditioning modules needed to be synchronized within microseconds.
Solution
Viewpoint leveraged another application, developed for the client a few years prior, to harmonize the user interface and to reduce development effort. Most of the development time focused on support and configuration of the multiple module types and ensuring that the data synchronization functioned as required. The result was an ultra-flexible, portable, high-speed data acquisition software/hardware combination that can be used to acquire time-sensitive, synchronized data across multiple modules in a PXI chassis running a real-time operating system.
Benefits
The upgraded system offers the following features:
- Highly configurable real-time data acquisition hardware/software solution based on LabVIEW RT and PXI hardware. Our client works closely with OEMs to assure compatibility and durability with their products, often going to the OEM’s test cells to collect performance data. The configurability in modules and channels affords the fastest possible setup at the OEM’s site which minimizes time and cost in the test cell.
- Configuration files stored in a SQL database format. Saving channel and module setups in SQL allows the test engineer to locate previous hardware and data acquisition configurations. The usual alternative is a bulk save of an entire system setup rather than using a more granular, and hence, more flexible approach afforded by using the database.
- Immediate test feedback through graphs and analog indicators, used to assure data quality before leaving the test cell.
- Data playback features after the data has been acquired, used for in-depth review of data after leaving the test cell.
- Data acquisition on the RTOS provides assurance that the acquisition will not be interrupted by network or other OS activities, which was occasionally an issue with the prior Windows-based application.
- Synchronization between signal conditioning modules ensures time-critical data taken on separate modules can be compared and analyzed.
System Overview
The system consisted of custom LabVIEW RT software intended to run on an engineer’s laptop and the PXI real-time controller and a PXI chassis populated with a flexible assortment of NI signal conditioning modules (provided by the client).
The software used an object-oriented Actor-based architecture, which facilitates adding new signal conditioning modules and flexible communications between the host PC and the real-time controller.
| SOFTWARE FUNCTIONS |
|---|
| DAQ Task Configuration |
| Event-Based DAQ Trigger |
| Data Synchronization |
| Real-Time Data Visualization |
| Data File Playback Utility |
| Datalogging to TDMS File |
| HARDWARE USED |
|---|
| PXIe Chassis (4,9 or 18-Slot) |
| PXI Real-Time Controller |
| PXI Multifunction I/O Module |
| PXI Digital I/O Module |
| PXI Counter/Timer Module |
| PXI Thermocouple Module |
| PXI DSA Module |
| PXI LVDT Module |
| PXI High-Speed Bridge Module |
| PXI Voltage Input Module |

Pump Test Station – Increasing throughput
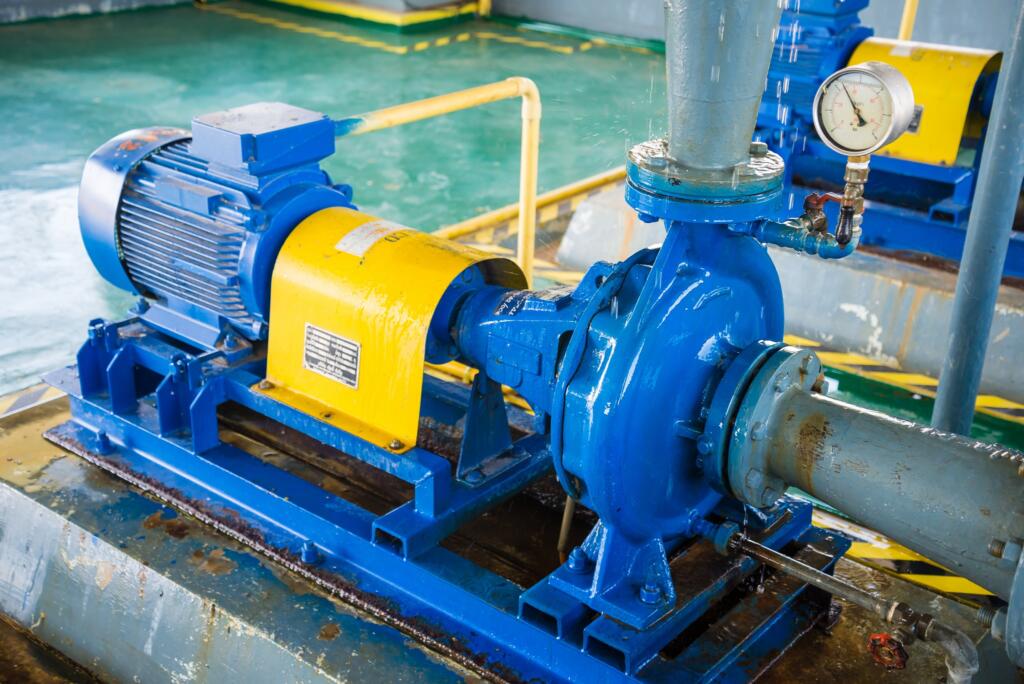
Pump Test Station – Increasing throughput
Standardizing on testing technique & reporting
Increasing test throughput with automation
Client – Industrial pump manufacturer
Challenge
Pump manufacturers typically test their product in the same facility in which the pumps are created. These tests are well defined and based on standards created by organizations such as API and ANSI to name a few. These tests are run to verify the performance of the pump as well as provide a report to the customer demonstrating that the pump they purchased will meet their needs. Sometimes these tests become factory witness tests where the customer sits in on the testing being performed on the pumps they had purchased.
This particular pump manufacturer had a test facility where many different sizes and types of pumps could be tested. The software provided to them by another integrator to run the test stand had the desired user interface screens, but did not function as requested, and was missing certain desired features.
Our client came to us with the following requests:
- Evaluate the software written by the previous integrator to assess whether any of the code could be reused in the new application.
- Ensure that existing cDAQ hardware would be compatible with changes and improvements to the software.
- Deploy the hardware/software solution on the test site to verify it performed as required.
Solution
The Pump Test Utility was used for end-of-line test and product validation.
It had the following features:
- A Pump Test application that can run one of the following tests at a time:
- Performance Test.
- Net Positive Suction Head (NPSH) Test.
- Mechanical Test.
- All test configuration and data files generated by the software must be compatible with Microsoft Excel.
- Ability to show vibration data real time while the test is running.
Benefits
- Standardization of testing technique –each pump will be tested with the same procedures and calculations/algorithms.
- Automated generation of report content and presentation – automation of this step will save hours of manually recording data and entering that data into a spreadsheet to generate the same report.
- Automation of the reporting and elimination of the need to manually record data will increase throughput of the testing facility.
System Overview
We developed the Pump Test Utility application to allow our client’s engineers and operators to:
- Run one of three guided tests that visually provides pump performance feedback during the test.
- Create a test configuration user interface that will be used to store configuration information that can be recalled when testing a similar pump.
- Automate the collection of data during the test.
- Automate the population of report templates with the configuration and data acquired during the test.
- View and print out vibration graphs real time during the test.
The pump test software was developed in LabVIEW.
It interfaced with simple delimited text files and Excel workbook templates to save the configuration information necessary to set up and run the required tests.
The resulting data acquired during the test, both raw data acquired from the sensors and calculated data used to characterize the pump being tested, are saved to delimited text files.
Both high-speed (10 kS/s) and low-speed (10 S/s) data are acquired. High-speed data are graphed real time in a separate UI that allows the user to set cursors on the graph for visualization and printing to a pdf report.
Low-speed data is written to a delimited text file for archival storage and retrieval if additional analysis is required.
The high-speed data are for vibration measurements. The low-speed data are for pressure, temperature, RPM and flowrate measurements.
Flow rate and vacuum pressure were automatically adjusted using a PID loop and 4-20 mA controlled valves.
The pump test configuration is performed within the application from a series of drop-down selections populated with sensors found in an Excel workbook. The Excel workbook is updated and maintained outside the application. Once the test sensors and conditions have been selected, those selections are written to an Excel workbook for use in the reports.
The Excel ActiveX interface was used to develop the reports the client provided to their customers for the slow data. The Excel workbook template contained the formatting necessary for the reports. As the software wrote the data into the workbook, the reports were built from the formulas and formatting already configured in the Excel template.
At the end of the test, the software printed the appropriate worksheets containing the elements of the report required. The vibration (high-speed data) is written to a binary file and a pdf.
| SOFTWARE FUNCTIONS |
|---|
| Data Acquisition |
| Test Sequencing |
| 3 Standardized Test Types |
| Generate Standard Table-Based Reports |
| Generate Pump Performance Graphs |
| Generate Vibration Graphs |
| Sensor Management Tools |
| Test Configuration Management Tools |
| HARDWARE USED |
|---|
| NI cDAQ Signal Conditioning Chassis |
| Variety of NI cSeries Signal Conditioning Modules |
| Pressure Sensors |
| Level Sensors |
| Flowmeters |
| Vibration Sensors |
| Displacement Sensors |
| Temperature Sensors |
| Torque Sensors |
| Speed Sensors |
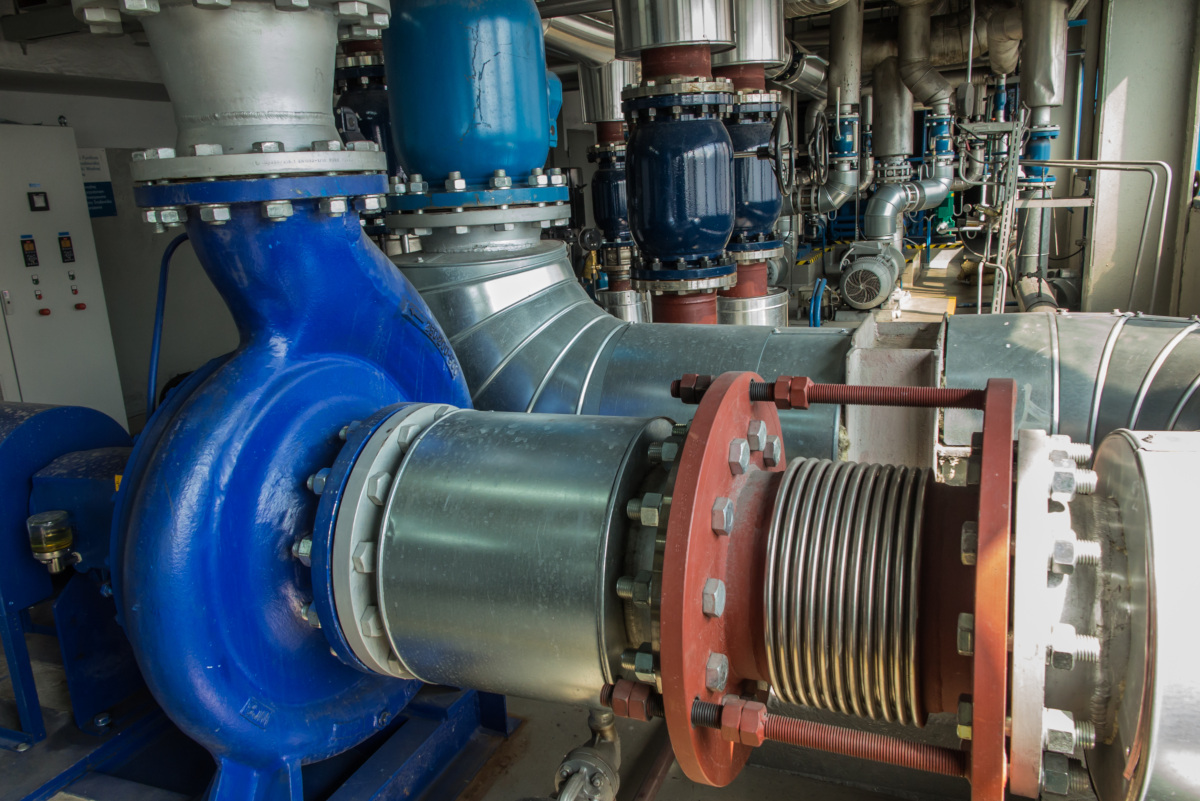
Pump Test Station
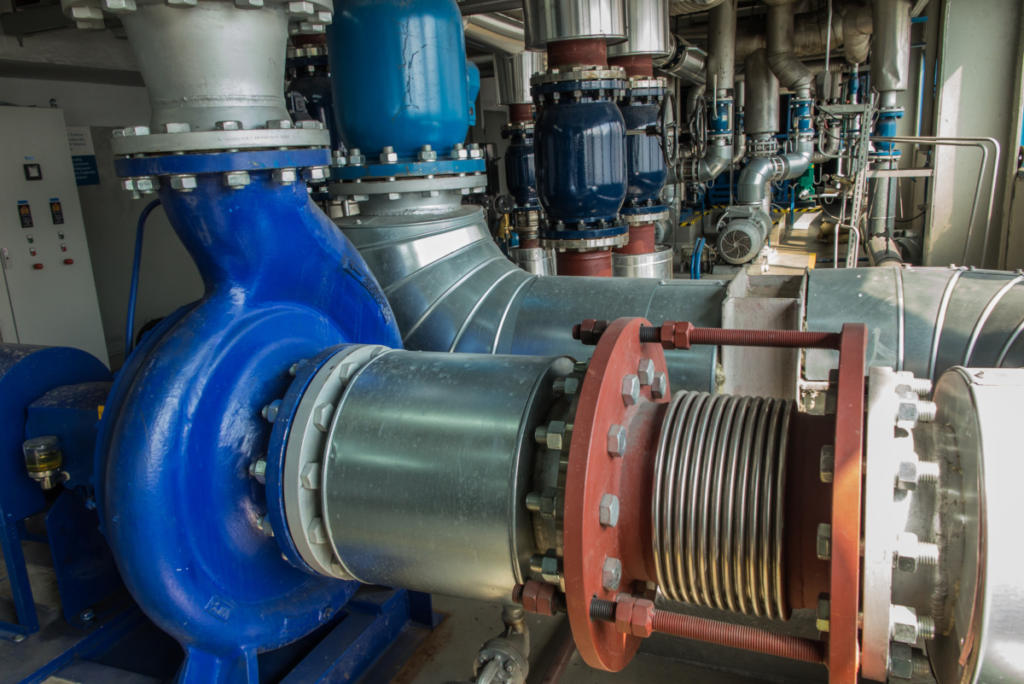
Pump Test Station
Client – Industrial pump manufacturer
Standardizing on testing technique & reporting
Reducing the number of pumps in the production queue
Challenge
Pump manufacturers typically test their product in the same facility in which the pumps are created. These tests are well defined and based on standards created by organizations such as API and ANSI to name a few. These tests are run to verify the performance of the pump as well as provide a report to the customer demonstrating that the pump they purchased will meet their needs. Sometimes these tests become factory witness tests where the customer sits in on the testing being performed on the pumps they had purchased.
Most pump manufacturers have more than one testing site at a facility to accommodate different pump types and sizes. The ability to automate these tests and to present a common look to the testing process and reports make the customer experience more positive to those reading the reports and/or witness the testing.
Our client came to us with the following requests:
- Evaluate the software written by the previous integrator to assess whether any of the code could be reused in the new application.
- Specify a hardware and software solution to acquire the signals needed to compute the performance results for standard tests. We made recommendations and selected appropriate hardware based on comments from our client about desiring compatibility between their test stands around the world.
- Deploy the hardware/software solution on the first test site to verify it performs as required and then deploy to the remaining test sites at their facility.
Solution
The Pump Test Utility had the following features:
- A Pump Test application that can run one of two different tests; a performance test and a net positive suction head (NPSH) test.
- An Access database was used to store the available sensors for that test site. The user selected the appropriate sensors while configuring the test.
- The test data was stored in an Excel file where each pump received its own Excel file.
- The LabVIEW Report Generation toolkit was used to populate the Excel file with data as well as create the report for the pump
Benefits
- Standardization of testing technique – now each pump will be tested with the same procedures and calculations/algorithms used are standardized across all test sites within the facility.
- Standardization of report content and presentation – now every customer that purchases a pump from our client will receive a report with identical information presented and that information will have been derived from the same calculations/algorithms.
- Reduction of the number of pumps in the production queue (and hence inventory) by roughly as much as 1/2 due to faster data acquisition and especially the archiving of the test results and the generation of the final report and its associated calculations.
System Overview
We developed the Pump Test Utility application to allow our client’s engineers and operators to:
- Run one of two guided tests that visually provides pump performance feedback during the test.
- Create a test configuration file based on an Excel template that will be used to store test data as well as generate a report.
The pump test software was developed in LabVIEW and interfaced with an Access database and Excel workbook to acquire the configuration information necessary to set up and run the required tests. The resulting data acquired during the test, both raw data acquired from the sensors and calculated data used to characterize the pump being tested, are saved to the Excel workbook. Both high speed (10 kS/s) and low speed (10 S/s) data are acquired and stored into one data file for archival storage and retrieval if additional analysis is required. The high-speed data are for vibration and sound measurements and low speed data are for pressure, temperature, RPM and flowrate measurements.
The pump test configuration is performed within the application from a series of drop down selections populated with sensors found in an Access database. The database is updated and maintained by the client through a series of user interfaces within the application. Once the test sensors and conditions have been selected, those selections are written to the Excel workbook for use in the reports.
The LabVIEW Report Generation Toolkit software was used to develop the reports the client provided to their customers. The Excel workbook template contained the formatting necessary for the reports. As the software wrote the data into the workbook, the reports were built from the formulas and formatting already configured in the Excel template. At the end of the test, the software printed the appropriate worksheets containing the elements of the report required.
| SOFTWARE FUNCTIONS |
|---|
| Data Acquisition |
| Test Sequencing |
| Metric or SAE Units |
| Multi-Level User Authentication |
| 2 Standardized Test Types |
| Generate Standard Table-Based Reports |
| Generate Pump Performance Graphs |
| Generate Vibration Graphs |
| Sensor Management Tools |
| Test Configuration Management Tools |
| HARDWARE USED |
|---|
| NI cDAQ Signal Conditioning Chassis |
| Variety of NI cSeries Signal Conditioning Modules |
| Pressure Sensors |
| Flowmeters |
| Vibration Sensors |
| Displacement Sensors |
| Temperature Sensors |
| Torque Sensors |
| Speed Sensors |

Industrial Monitoring for a Harsh Environment
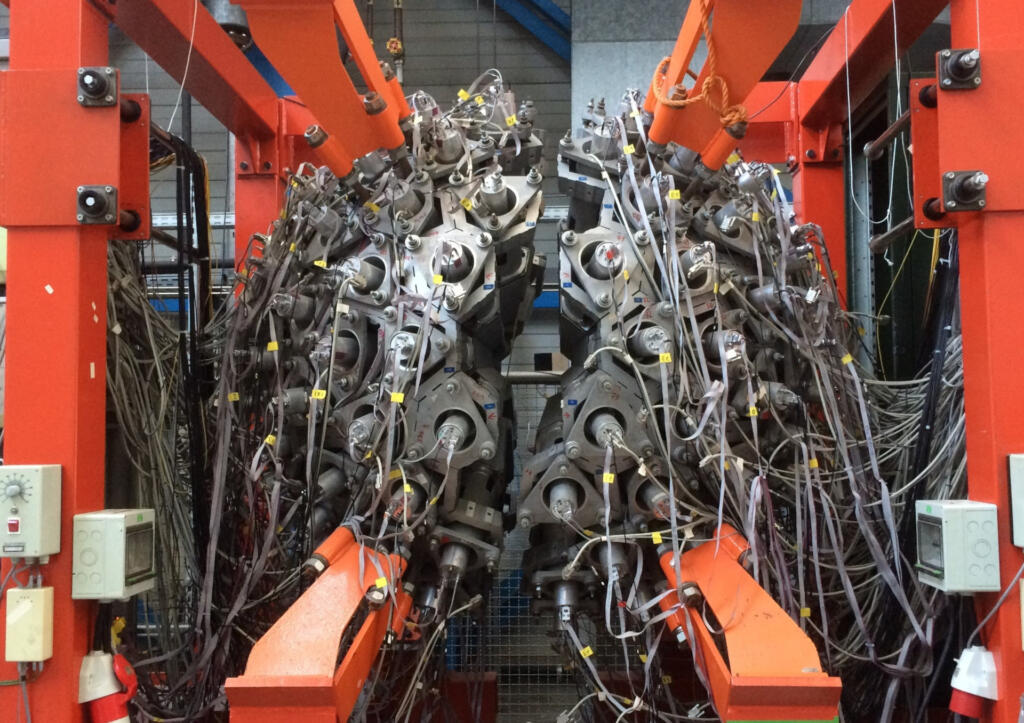
Industrial Monitoring for a Harsh Environment
Developing an industrial monitoring system for ultrasound-based sensing in a harsh environment
Client – Energy Research Lab
Challenge
Our client was experiencing problems making temperature measurements in a hostile, irradiated environment. Traditional temperature sensors don’t last long in this environment, so our client was developing a sensor designed for these conditions.
Special equipment is required to drive this sensor. It’s an active sensor requiring an ultrasound pulser/receiver (P/R) and high-speed digitizer to make it function.
The prior attempt the client made at using an original set of special equipment was having reliability and connectivity issues. This reduced reliability was of critical concern due to the requirement for the sensor to operate for years without downtime.
In addition, the existing application was incapable of displaying live data and lacked a user-friendly interface. On top of that, data analysis had to be done after the application was run, causing delays.
Our client needed reliable and robust hardware to drive the sensors and an application that would eliminate the challenges associated with the existing system.
Solution
Viewpoint accomplished the following:
- Evaluated two different ultrasonic P/R sensor driver hardware solutions to select a solution that would provide the connectivity robustness, configurability, and correct sensor driver characteristics required for the given sensors.
- Decoupled the digitizer embedded in the original P/R by adding a PXI digitizer with better capability.
- Provided backward compatibility with previous measurement hardware to aid in performance comparisons with the new hardware.
- Developed a LabVIEW-based application that corrected all the issues with the existing application including real-time data analysis, real-time data visibility and a modern user interface. The new application also provided sensor performance traceability using the sensor’s serial number.
We selected the NI hardware and non-NI equipment to assure compatibility.
Benefits
The enhanced measurement system offers the following benefits:
- Reliable sensor subsystem to ensure uninterrupted data acquisition.
- Measurement hardware configurability for sample rate, collection duration, and pulsing repetition rate.
- Application configurability for automating the analysis, historical archiving, and results reporting.
- Real-time data analysis.
- Sensor traceability through serial number and data files.
- Engineering mode to take control of the entire measurement system.
- Improved data logging to include raw and analyzed data.
- Improved application user experience via robust data collection and configurability.
System Overview
The deployed temperature monitoring system consisted of the following components:
- COTS pulser/receiver hardware for driving the sensors.
- COTS high-speed DAQ for retrieving ultrasound signals.
- A LabVIEW-based software application to provide real time data monitoring, error/alarm notification, data analysis, data logging, part traceability and backward compatibility with the older sensor driver hardware.
| SOFTWARE FUNCTIONS |
|---|
| Acquire Data from Sensor Driver Device |
| Data Analysis |
| Write Raw Data to File |
| Write Analyzed Data to File |
| Configuration Utility |
| HARDWARE UTILIZED |
|---|
| Sensor Pulser/Receiver Driver |
| NI PXIe Expansion Chassis |
| NI PXI Oscilloscope Module |
| NI PXI Thunderbolt 3 Module |
| INTERFACES / PROTOCOLS |
|---|
| RS-232 |
| Thunderbolt 3 |
Custom FlexRIO Adaptor Module supports HIL Test Upgrade
Custom FlexRIO Adaptor Module supports HIL Test Upgrade
A custom-COTS approach reduces cost and delivery time.
Client – Major National Research Lab

Challenge
Our client has a client (the end-user) for which they developed an HIL test system several years prior. Parts were obsolete and the system needed an upgrade. The prior system had many custom-designed electronic components which could not be replaced without a complete redesign.
Consequently, our client wanted to use COTS. However, one device needed 28 VDC digital I/O, a couple of lines which carried significant current (amp, not milliamp, levels) and at switching rates much higher than a COTS solid state relay could provide.
Solution
Viewpoint reviewed the requirements and created a hybrid COTS-custom solution. We combined an NI FlexRIO module with a custom FlexRIO Adapter Module (FAM) for the front end to satisfy the 28 VDC signals levels and required current drive.
Benefits
- COTS FlexRIO integrates into the remainder of our client’s PXI-based test system.
- The Custom I/O was designed for flexibility. Our client can use this FAM for both their initial end-user and other programs / clients too.
- Reduced cost relative to a completely custom solution.
- Delivery time reduced by months relative to a custom solution
FAM Overview
The custom FAM interfaced with the NI FlexRIO module, which offered low-level digital I/O (3.3 V logic), to digital signal conditioning hardware that provided the 28 VDC signal levels and required current drive.
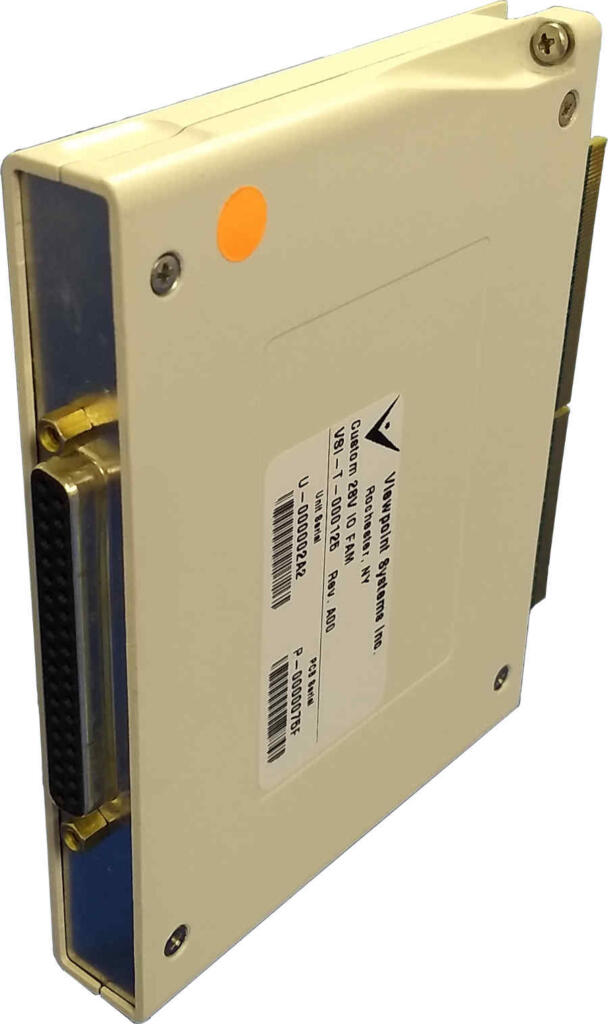
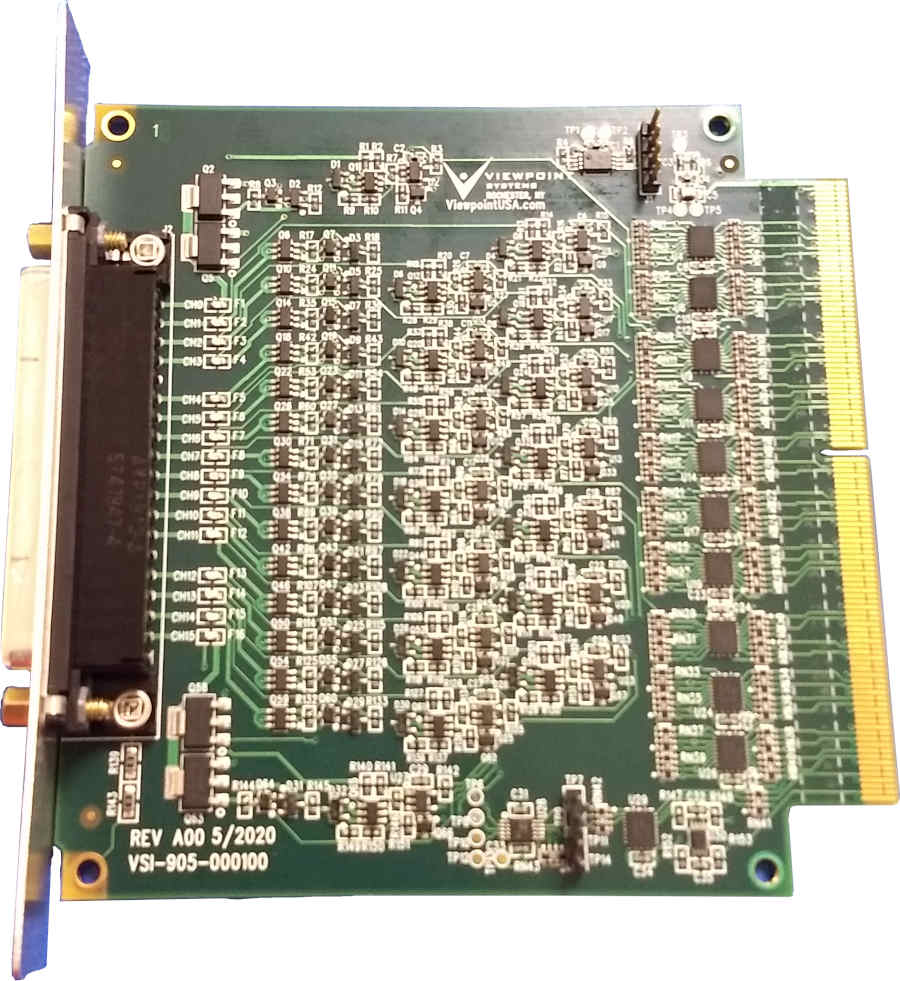
Each I/O pin was configurable as input or output (source or sink). Each bank of 4 channels had an adjustable threshold level set via an adjustable DAC output. Some of the channels are designed for amp-level current drive, while the remainder were 250 mA. All I/O was fused appropriately.
Viewpoint also developed LabVIEW FPGA and VHDL to enable our client and the end-user to:
- Configure the I/O as in or out.
- Communicate to the DAC to allow custom input threshold trigger levels.
- Read and write the digital data.
| SOFTWARE FUNCTIONS |
|---|
| Set the direction of each of the DIO channels |
| Set the threshold level on the input channels |
| Read / Write DIO Data |
| End User Application |
| HARDWARE UTILIZED |
|---|
| COTS NI FlexRIO |
| Custom FlexRIO Adaptor Module(FAM) |
| INTERFACES / PROTOCOLS |
|---|
| Customized VHDL Component Level Intellectual Property (CLIP) integrated with LabVIEW FPGA |
| LabVIEW FPGA as required along with LabVIEW and TestStand |
High-Speed Digital Subsystem Emulator
High-Speed Digital Subsystem Emulator
Client: A large company involved in C4ISR
At maximum throughput, the AEDIS systems needed to consume and produce more than about 800 MB/s/slot.
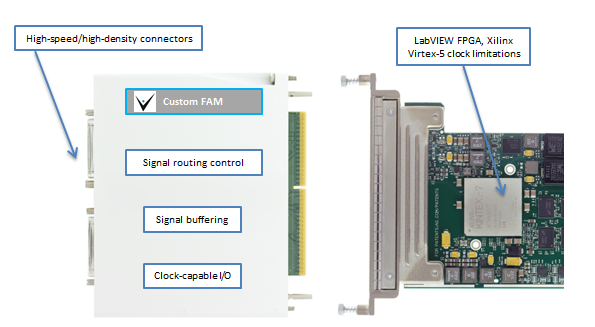
Background
A large company involved in C4ISR was developing a system for a new high-speed digital sensor device. Viewpoint was contracted to build a test system used in design validation and ultimately endurance testing of the sensor. Since the sensor was a component of a larger system which was being developed at the same time, another test system was created to simulate the sensor by feeding signals into the system. This ability to use HIL testing for both the sensor and the downstream sensor electronics enabled parallel development, thus saving time and reducing schedule.
Challenge
Both the amount of data and the frequencies of the various digital signals were nearly at the limit of hardware capabilities. At maximum throughput, the systems needed to consume during record and produce during playback about 800 MB/s/slot. The FPGA clock on the FlexRIO had to run up to 300 MHz. The skew between triggers for data transmission needed to be less than 5 ns even between multiple FlexRIO cards even when the parallel data paths have inherent skews associated with the sensor. Finally, the systems needed to handle clocks that might be out-of-phase.
Achieving these requirements required significant engineering design in the face of multiple possible roadblocks, any one of which could have eliminated a successful outcome.
Furthermore, as usual, the development timeline was tight. In this case, it was a very tight 3 months. Basing the solution on our AEDIS platform was critical to meeting this challenge.
Viewpoint’s Solution
To meet the timeline, we had to work in parallel across several fronts:
- LabVIEW-based application development for both record and playback
- LabVIEW FPGA development for marshalling data between the controller and DRAM
- Custom FAM circuit board design and build
- FlexRIO FPGA CLIP nodes and code for low-level data handling
Technical Highlights
This sensor had several parallel data paths of clock and data lines with clock speeds up to 300 MHz on each path requiring exacting design and build of a custom FlexRIO Adapter Module (FAM) and unique custom CLIP nodes for extending the FlexRIO FPGA capabilities. The FAM also had a special connector for interfacing to the customer’s hardware.
Additional NI hardware and software completed the system components.
Results
The choice to base the AEDIS emulators on NI hardware and software was critical to completing this project. The open architecture in both hardware (custom FAM) and software (CLIP Nodes) enabled us to include some very creative extensions to the base toolset without which the project would not have succeeded in the allotted pressured schedule and on a predetermined budget. We were able to stretch the capabilities of the hardware and software very close to their maximum specifications by combining COTS and custom much more cost effectively than a purely custom design. Further, with HIL tests, both the sensor and the sensor electronics could be developed in parallel, leading to a significant schedule buyback for our client.
LabVIEW Layers
The host application, written in LabVIEW, managed the configuration of the data acquisition and the control of the LabVIEW RT-based FlexRIO systems. The configuration primarily dealt with the number of sensor channels in use, skew settings between digital lines, and other parameters that dealt with the organization of the data passed between the sensor and the FlexRIO.
Two FlexRIO applications were written, one for record and one for playback. Each FlexRIO application was written in LabVIEW, and managed the configuration of the FlexRIO cards and the movement of data between the FlexRIO cards and the RAID drives. Note that Windows supported for the RAID driver. Between 10 and 32 DMA channels were used for streaming, depending on the number of sensor channels being used.
And, each FlexRIO application had an FPGA layer, written in LabVIEW FPGA enhanced with custom CLIP nodes. For the record application, we developed a custom DRAM FIFO on the FPGA to assist with the latencies on the PXIe bus. For the playback application, we were able to stream directly from DRAM.
FlexRIO Considerations
The FlexRIO and stock FAMs from NI were initially considered as candidates for this project. Clearly, working with commercial-off-the-shelf (COTS) components would be most effective. Three options were available at the project start which could accommodate the required clock frequencies, but none offered both the required channel counts and skew/routing limitations. Hence, we had to design a custom FAM. This decision, made before the start of the project, turned out to be wise in hindsight because the parallel development path resulted in some shifts of sensor requirements which could be accommodated with the custom FAM but might have led to a dead-end with a COTS FAM.
FlexRIO CLIP
In LabVIEW FPGA, a CLIP Node is a method to import custom FPGA IP (i.e., code) into a LabVIEW FPGA application. CLIP stands for Component-Level Intellectual Property. We needed to use special Socketed CLIP Nodes (i.e., VHDL that can access FPGA pins) for this project because we could expose additional features of the Xilinx Virtex-5 not exposed in LabVIEW FPGA by accessing Xilinx primitives. Some specific features were:
- Faster FPGA clocking
- Additional clocking options
- Individual clock and skew control
- Custom PLL de-jitter nodes
Essentially, the FPGA design had a majority of FPGA code developed in LabVIEW FPGA and we used CLIP Nodes for interfacing the signals between the FlexRIO and the FAM.
FlexRIO Adapter Module
As mentioned earlier, we had to create a custom FAM because of the need to route high speed signals from customer-specific high density connectors while synchronizing signals across multiple data channels and FPGA modules to within one (300 MHz) clock cycle.
At these high-speeds, the FAM needed careful buffering and impedance matching both on the signals as well internal components on the FAM PCB. At the start of the design, we utilized Mentor Graphics HyperLynx High Speed DDR signaling Simulation software to minimize signal reflections prior to building actual hardware. This step saved countless hours in spinning physical hardware designs.
We designed the FAM to allow channel routing and access to additional clock and trigger pins on the Xilinx chip and PXIe backplane.
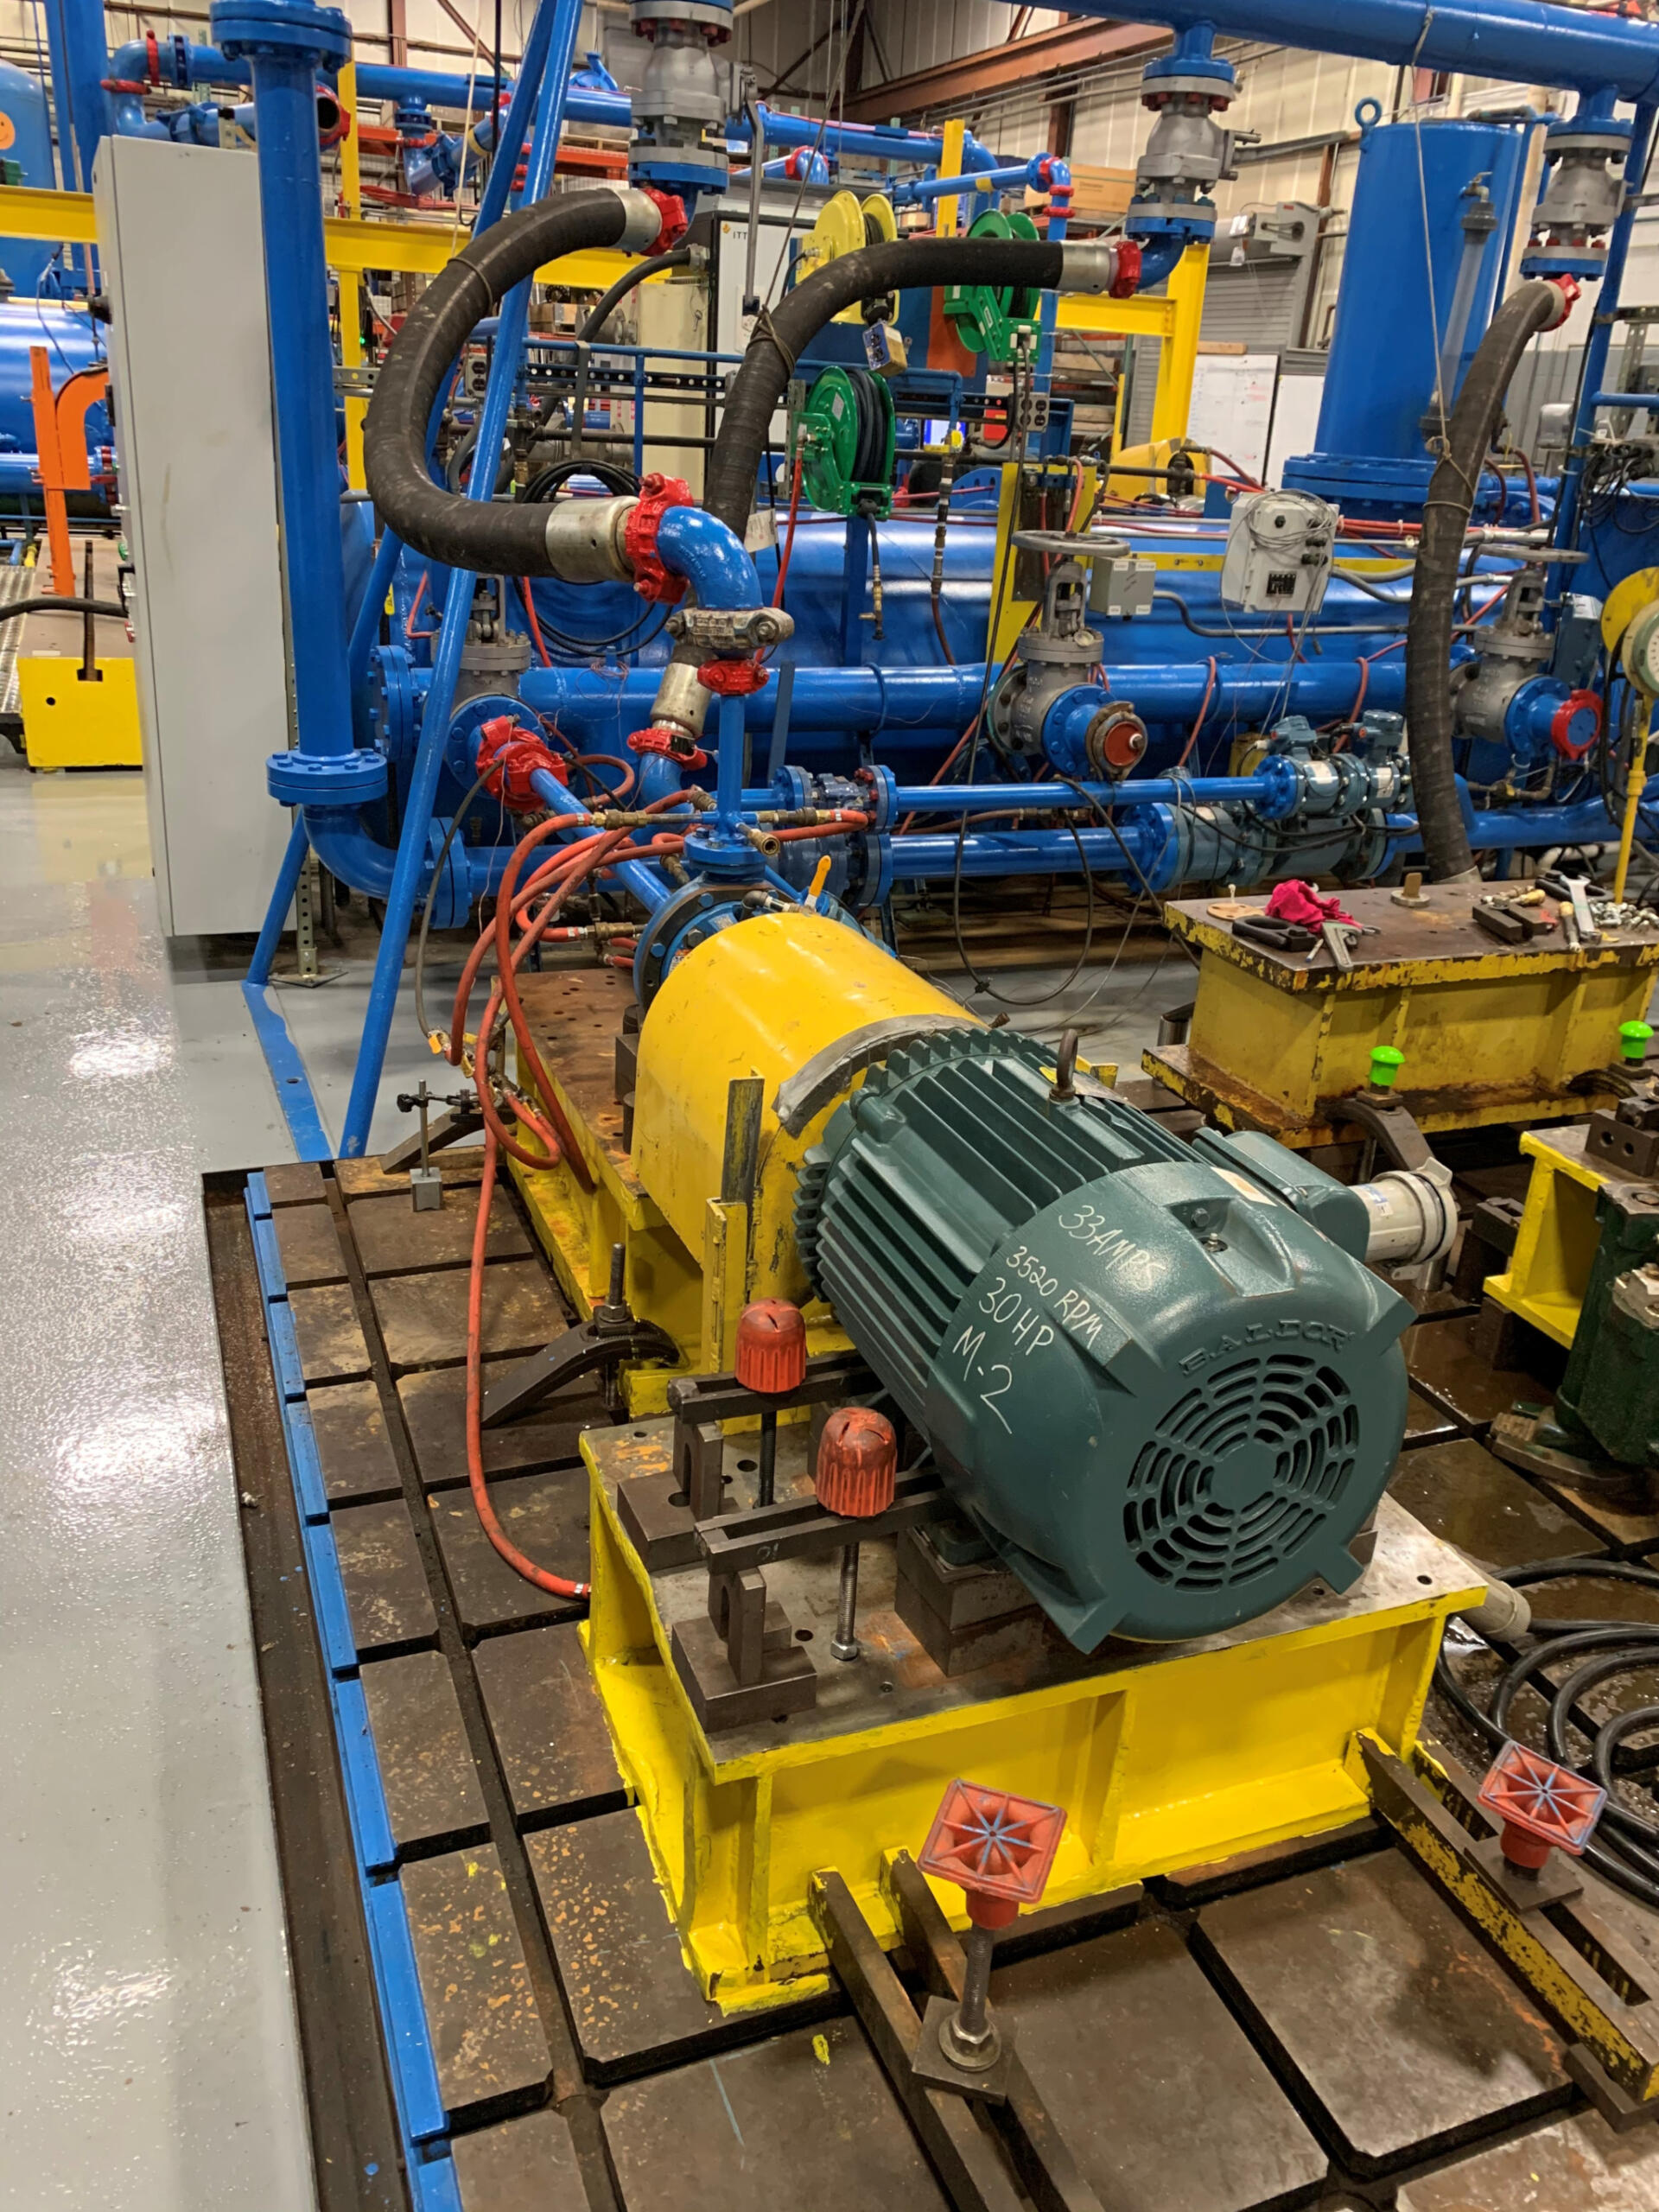
Pump Test Station Used Across Multiple Locations Worldwide
Pump Test Station Used Across Multiple Locations Worldwide

Client – ITT Goulds Pumps
Challenge
Pumps are used for everything from sump pumps for the consumer home market all the way to large pumps for industry capable of moving thousands of gallons per minute. Just as varied is the fluid being pumped: from water to slurries to hydrocarbon-based fluids.
Pump manufacturers typically build and test in plants across the world and each of those facilities is responsible for testing every pump manufactured at that site to ensure that the pump will perform as the customer expects. These tests are well defined and based on standards such as API, ANSI and other organizations. These standards provide test procedures but do not give details as to how to perform the tests. Each site typically tests their product without guidance as to how to satisfy the aforementioned standards. As a result, differing hardware and software solutions are usually put in place to test the individual site’s products.
Such varied testing systems make it exceedingly difficult to compare test results across testing sites, both within plants and between plants.
We were asked by our client to create a homogeneous test platform with which they could compare data across manufacturing plants and test sites within the plants as well as automate calculations of plant performance metrics and reporting.
This client engaged us to develop and implement a software and information storage solution that could run the prescribed tests on any testing site and make these data available to their engineers. These tests were to be semi-automated and guide the test operator through a test ensuring that the procedure and the resulting data were collected in the same manner on every test site, worldwide.
Solution
The Pump Test Globalization application consists of the following sub-applications:
- A Pump Test application that can run 1 of five different tests simultaneously to reduce the amount of time the UUT is under test. A separate data file is generated for each test and those data files are stored in the database along with the test results.
- A Test Configuration application that helps to manage the orders and the tests association with those orders.
- A Report Generation application that creates a report for each test run on a pump. Additional performance graphs are generated along with options for graphs depicting vibration and orbital performance of the pump.
Benefits
- Standardization of testing technique – now each pump will be tested with the same procedures and calculations/algorithms used are standardized across all manufacturing test sites.
- Standardization of report content and presentation – now every customer that purchases a pump from our client, regardless of origin of manufacture, will receive a report with identical information presented and that information will have been derived from the same calculations/algorithms.
- Ability to generate manufacturing performance data – metrics such as first pass yield may be calculated for all manufacturing sites. Data from all manufacturing sites may now be compared.
- Abstraction of data acquisition hardware – measurement data can be acquired from a variety of sources including OPC servers and NI DAQ Hardware. With this abstraction, the client’s existing hardware was reused where it made sense and replaced with new hardware as needed.
System Overview
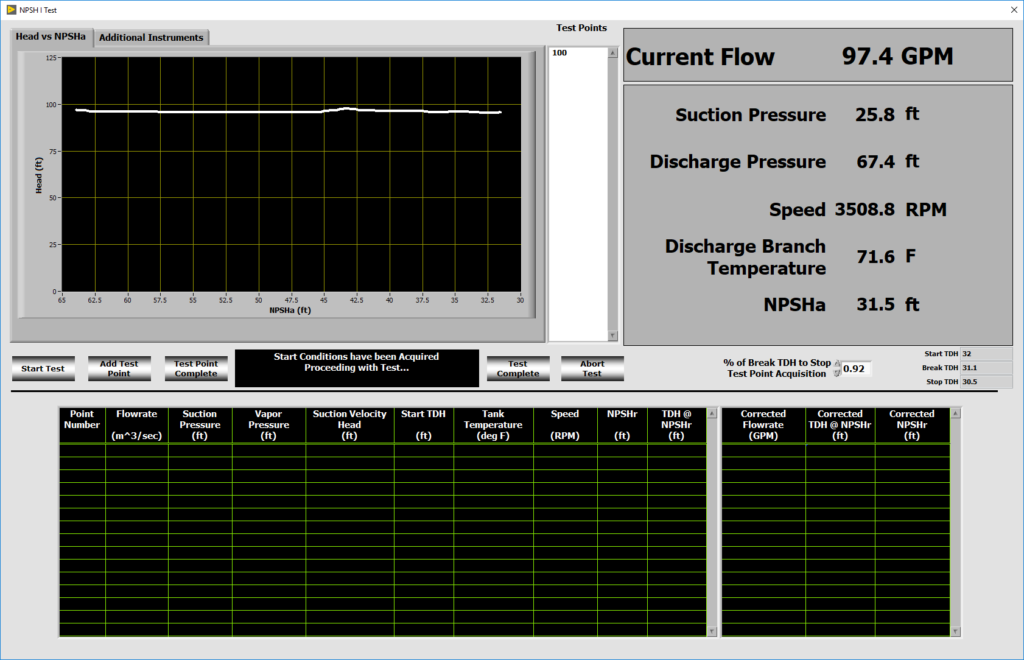
We developed Pump Test, Pump Test Configurator and Pump Test Report Generator applications to allow our client’s engineers and operators to:
- Run one or a series of guided tests that visually provides pump performance feedback during the test.
- Configure a test for a specific pump model number and serial number. This configuration is read in by the Pump Test software to set up the test according to the configuration.
- Generate a report that would be sent with the pump to their customer showing how the pump performed and that it met the customer’s requirements.
The pump test software was developed in LabVIEW and interfaced with a SQL database to acquire the configuration information necessary to set up and run the required tests. The resulting data acquired during the test, both raw data acquired from the sensors and calculated data used to characterize the pump being tested, are saved to the database. Both high speed (10 kS/s) and low speed (10 S/s) data are acquired simultaneously and stored into one data file for archival storage and retrieval if additional analysis is required. The high-speed data are for vibration and orbital measurements and low speed data are for pressure, temperature, rpm and flowrate type measurements.
The pump test configuration software was also developed in LabVIEW and is a separate application that uses a SQL database on the back end. The database is located on a secure server and has been designed to retain the following information:
- Lists of all the manufacturing and test facilities.
- List for all the motors used for running the pumps.
- List for all the available sensors and hardware for each test station for every manufacturing plant.
- Ability to associate each sensor with a hardware channel for acquisition.
- Create and edit orders that contain pump specific information such as model number and serial number.
- Create and edit test configuration information for a given order.
The report generation software was also developed in LabVIEW and provides the user a means to create standard reports for each of the test types. Additional addendums to the standard report can be created to include graphs utilizing the high-speed data such as vibration and orbital information.
| SOFTWARE FUNCTIONS |
|---|
| Data Acquisition |
| Test Sequencing |
| Test Configuration Verification |
| Language Localization |
| Metric or SAE Units |
| Multi-Level User Authentication |
| 5 Standardized Test Types |
| Generate Standard Table-Based Reports |
| Generate Pump Performance Graphs |
| Generate Vibration and Orbital Graphs |
| Pump Order Management Tools |
| Sensor Management Tools |
| Test Configuration Management Tools |
| HARDWARE USED |
|---|
| NI cDAQ Signal Conditioning Chassis |
| Variety of NI cSeries Signal Conditioning Modules |
| Various OPC Servers for PLC Communications |
| Pressure Sensors |
| Flowmeters |
| Vibration Sensors |
| Displacement Sensors |
| Temperature Sensors |
| Torque Sensors |
| Speed Sensors |
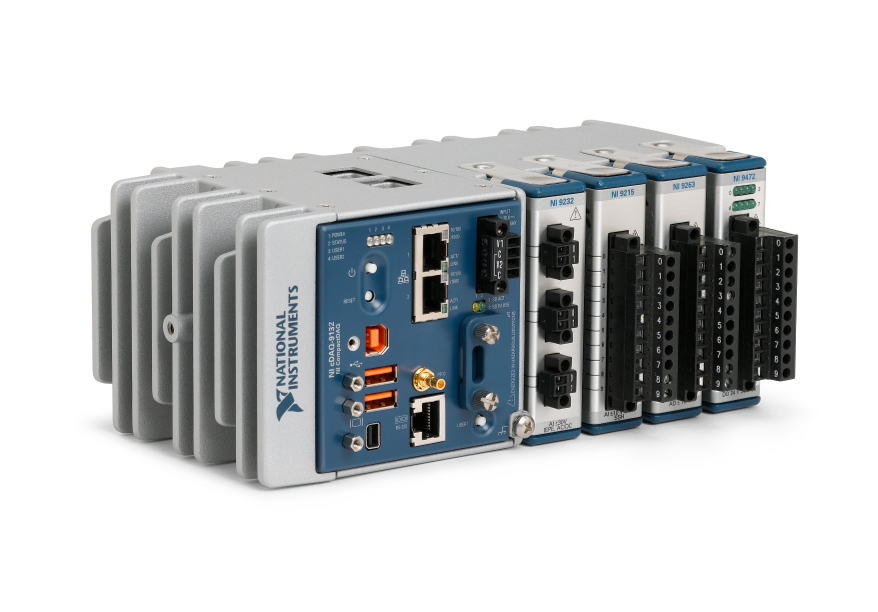
Custom Endurance Test System – for a medical device
Custom Endurance Test System – for a medical device
Increased level of automation allows for multi-day and multi-week test runs
Client
A medical device manufacturer
Challenge
Our client wanted to improve the endurance testing of an implantable medical device product to help determine the recommended lifetime of the product. An obsolete test system existed, but the client wanted improved performance, UX and configurability. They wanted to just hit the “go” button and let it run for days or weeks. They also needed to be able to have new features added after the first release.
Solution
The custom product validation endurance test system utilizes NI cDAQ off-the-shelf hardware combined with custom LabVIEW-based software to provide automated N-up endurance testing of the UUT. The specific NI hardware selection was driven by both capabilities and physical space requirements. We suggested cDAQ to our client because of its small physical footprint (we connected it to a somewhat remote PC) and ability to expand into other future endurance testing needs by swapping out modules as needed.
Benefits
- Higher fidelity DAQ
- Increased configurability of the system to run tests the way the client wants to
- Increased level of automation allows for multi-day and multi-week test runs.
System Overview
The endurance tester physically stresses the UUT to measure force and eventually breakage events. These events are used to help determine the recommended lifetime of the product. The tester tests multiple UUTs in parallel in order to gather more data faster for statistical validity. The system collects data until all UUTs break or the operator stops the test.
Viewpoint provided the software and advised DAQ hardware selection. The rest of the test system hardware was selected and assembled by the client.
The automated test system applies a varying cyclical force to multiple UUTs while measuring the force applied to the device. The software automates the data acquisition, analysis, load application, and motor during a test. The system measures all forces applied simultaneously while synchronizing that data to a cycle counter. That data is analyzed to determine average, maximum, and minimum force applied to the device over a user configurable number of cycles.
While running there are multiple alarm states that are monitored. When these alarm states occur, a file can be generated to dump a user configurable duration of force measurements to a file. Other alarms generated trigger the system to change a digital output state triggering a text message to be sent to the operators of the system. The system was designed to test for weeks at a time.
| SOFTWARE FUNCTIONS |
|---|
| Test Sequencer |
| UI |
| Data Logging |
| Report Generation |
| Breakage Event Detection |
| HARDWARE USED |
|---|
| NI cDAQ |
| Multiple NI load cell cSeries modules |
| NI cSeries Digital Input module |
| NI cSeries Digital Output module |
NI FlexRIO-based Custom Test Equipment for High Speed Digitizer sensor

NI FlexRIO-based Custom Test Stand for High-Speed Digitizer sensor
The initial interface/test system to the DUT was up and running and getting real data from the DUT in ~2 weeks, allowing the customer to maintain a tight development schedule.
Client – A Large Manufacturer
Challenge
Our client was developing an image sensor component and needed to validate the part for a new product line. They wanted to use as much COTs hardware as possible to start testing as soon as possible.
Solution
The custom product validation test equipment utilizes the NI PXI with FlexRIO off-the-shelf hardware combined with custom LabVIEW-based software.
Benefits
- The initial interface/test system to the DUT was up and running and getting real data from the DUT in ~2 weeks, allowing the customer to maintain a tight development schedule.
- Packet Decode completed at FPGA Level allowed error handling and only pertinent data being saved as needed.
- Data Manipulation done at FPGA level for unbundling data into correct disk readable format in real-time.
- All Data captured with TDMS Files to disk enables a higher level of analysis of the data offline.
System Overview
The new PXI-based automated test stand utilizes NI’s FlexRIO with NI stock LVDS FAM.
- Custom VHDL was created to handle the required adjustable delay lines in the data I/O lines and interface to the I/O on the FAM Connector.
- The VHDL interfaced to LabVIEW FPGA which was utilized to stream the data to disk.
- Data is stored onto disk during a test and only the payload data from decoding the protocol is saved.
- The data coming from the UUT is de-packetized and ordered for manipulation downstream.
| SOFTWARE FUNCTIONS |
|---|
| Custom FAM VHDL and LabVIEW FPGA interface Development |
| Custom LVDS Adjustable Delay lines per LVDS Data stream |
| LVDS Buffering |
| Generate multiplied Clock from external clock input to latch in data |
| Source the multiplied clock to Internal LabVIEW FPGA Clock |
| FIFOs for clock domain crossing and DMA |
| High-speed data streaming to Disk |
| LabVIEW RT for example interface to FPGA |
| GUI |
| HARDWARE USED |
|---|
| 19″ rack test stand |
| NI FlexRIO |
| NI FlexRIO FAM – LVDS |
| NI LVDS to flying lead cable |
| NI PXI chassis and controller |
NI FlexRIO enables Device Evaluation & Characterization for high-data-rate sub-system
NI FlexRIO enables Device Evaluation & Characterization for high-data-rate sub-system
100s of man-hours saved in capturing the data.
Client – Automotive Manufacturer
Challenge
New product development drove the need for validation of a new sub-system (a RADAR sensor ) for use in a next-gen system in an automobile. They needed a way to evaluate and characterize the performance of the component under various conditions that were not defined in the UUTs specs. They wanted to use as much COTS hardware as possible for this first run testing because of the expense of a custom test solution and the timeline.
Solution
The NI FlexRIO-based product validation system utilizes COTS hardware, along with some Viewpoint-developed custom software to allow for evaluation and characterization of the UUT.
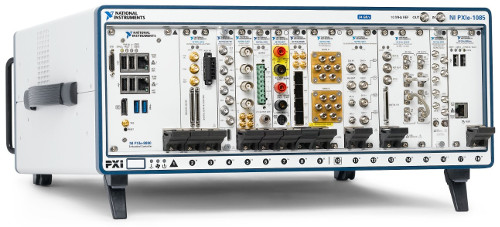
Benefits
- The utilization of COTs (vs a custom-built FPGA board) test hardware.
- 100s of man-hours saved in capturing the data.
- Allowed customer to manipulate captured data within the LabVIEW environment for more efficient testing, making changes on the fly.
- Error Checking done at the FPGA Level allows for guaranteed valid transfers
- Packet Decode completed at FPGA Level allows for real-time de-packetization for use in storing only payload data.
- All Data captured with TDMS Files for use in over layering different scenarios.
- Scalable to add additional serial data channels allowing for more than one sensor to be captured with a single FlexRIO card.
System Overview
NI’s FlexRIO with NI’s LVDS FAM was used. The NI flying lead cable was utilized initially to connect to the UUT. On the software side custom VHDL was created to handle the 8b/10b serial stream data and clock recovery. The VHDL interfaced to LabVIEW FPGA which was utilized to stream the data to disk on the PXI-based system.
| SOFTWARE FUNCTIONS |
|---|
| Custom FAM VHDL and LabVIEW FPGA interface Development |
| Aurora 8b/10b de-serialization and clock recovery |
| LVDS Buffering |
| Clock to Internal LabVIEW FPGA Clock |
| FIFOs for clock domain crossing and DMA |
| High Speed data streaming to Disk |
| LabVIEW RT for example Interface to FPGA |
| GUI |
| HARDWARE USED |
|---|
| NI FlexRIO |
| NI FlexRIO FAM – LVDS |
| NI LVDS to Flying lead cable |
| NI PXI Chassis and Controller |
| INTERFACES / PROTOCOLS |
|---|
| Aurora 8b/10b |
| TCP/IP |
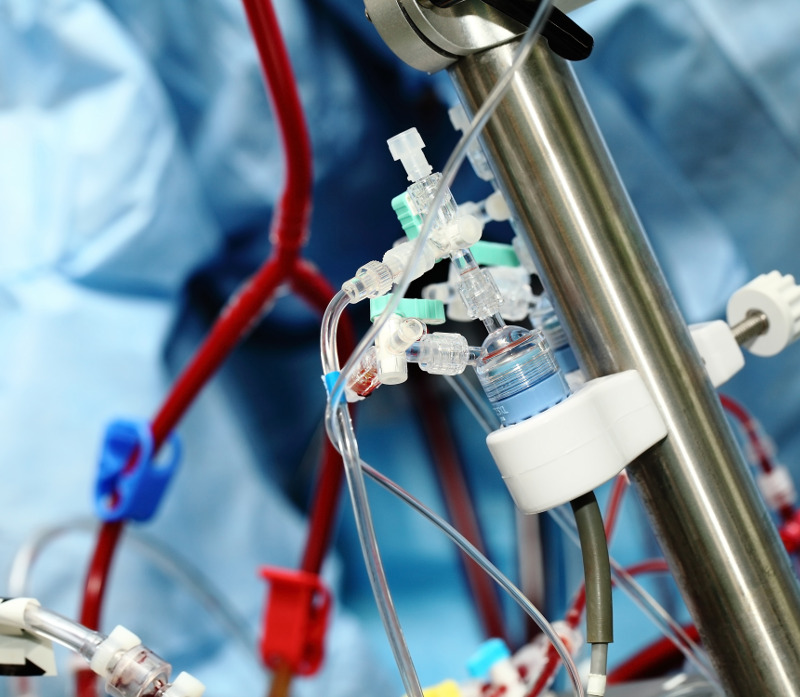
Custom Test System Using NI PXI for Electrical Test
Custom Test System Using NI PXI for Electrical Test
Updating an obsolete tester that maintains functionality
Client – Medical Device Manufacturer
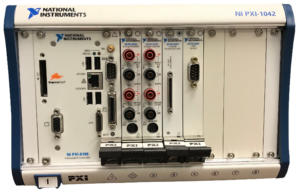
Challenge
Our client already had a test system in place, but the tester (really two test systems testing two different product variants) was becoming obsolete. The tester was old, hardware was failing, and it was getting harder and harder to keep it reliably running. They wanted a new tester to improve reliability, but maintain the functionality of the existing tester to keep the FDA-mandated verification and validation time to a minimum.
Solution
The updated end-of-line manufacturing test system maintains the functionality of the old test systems, but with updated hardware and software. The same software is utilized for both the manual test system update and the automated test system update. Our client deployed 6 manual testers and 1 automated tester.
Benefits
- Improved maintainability and reliability with updated hardware and software
- Maintains existing test system functionality to keep certification time down
System Overview
There were two variants of the new test system. One was for an older product line that utilized manual test, with an operator that connected/disconnected the UUT, and initiated the test. The other was an automated tester, integrated into a manufacturing machine. Both testers utilized custom fixtures (provided by the client), off-the-shelf NI measurement hardware (selected by Viewpoint), and custom test software (developed by Viewpoint). The software is configurable for both the manual test system and the automated test system.
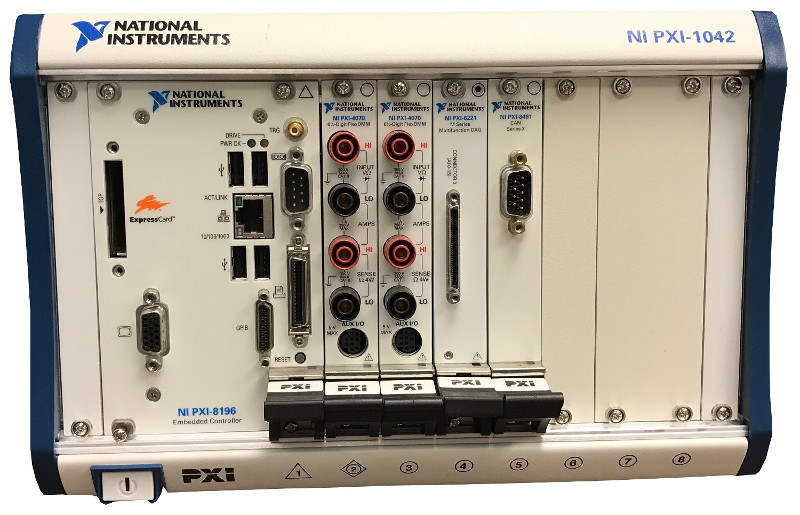
| SOFTWARE FUNCTIONS |
|---|
| Read UUT limits from config file |
| Perform tester self-test |
| Measure impedance |
| Power UUT |
| Pressurize UUT |
| Measure UUT output |
| Perform leak down pressure test |
| PLC interface (for automated tester) for start, done, pass, fail |
| HARDWARE USED |
|---|
| Custom test fixture (provided by client) |
| NI PXI |
| PXI Multifunction I/O Module |
| PXI Digital I/O Module |
| PXI Relay Module |
| PXI Digital Multimeter Module |
| PXI Switch Matrix Module |
*- images are conceptual, not actual
Manufacturing Inspection System Uses Machine Vision to verify assembly and labeling
Manufacturing Inspection System Uses Machine Vision to verify assembly and labeling
Reducing human error with automated inspection
Client – Automotive Component Manufacturer
Challenge
Our client already had an end-of-line tester in place. However, preventing incorrect product shipments drove them to add machine vision capabilities to verify that the part being packed is of the correct physical configuration and that the part was labeled correctly. They also wanted a more automated way to track which serial numbers were being shipped.
Solution
Viewpoint enhanced the existing end-of-line tester by adding machine vision capabilities to verify correct part assembly and part labeling. This capability also allowed for automated tracking of which parts went into which shipping container.
Benefits
- Automated part assembly verification to reduce human error from manual visual inspection
- Automated label verification to reduce the chance of shipping the wrong product
System Overview
The enhanced system added machine vision-based capabilities to an existing end-of-line manufacturing test system. New hardware (cameras, lighting, fixture) was selected and integrated by the client. Viewpoint developed the image analysis routines using the Cognex In-Sight software. These routines were then downloaded and controlled using LabVIEW software developed by Viewpoint. In addition, the LabVIEW GUI contained the image acquired by the camera and the results of the image analysis. The tester can inspect four different part types.
The software essentially performs the following functions:
- Look up the expected characteristics of the part being inspected.
- Populate the on-camera In-Sight “spreadsheet” with configuration information used in the image analysis/inspection.
- Trigger the image capture and read results from the on-camera spreadsheet.
- Use the on-camera image analysis to check a critical angle of the part as the part is set in the nest fixture.
- Check the information laser etched on the part and compare the results with what should be on the part (relative to the barcode read in for the lot and the 2D barcode on the part) using the OCR/OCV capabilities of the camera.
- Perform other physical part characterization image analyses to verify the part was correctly labeled & assembled.
| SOFTWARE FUNCTIONS |
|---|
| Look up expected part characteristics |
| Trigger image capture |
| Read results of on-camera image analysis |
| Display image taken by camera and show if test passed or failed |
| Monitor contiguous part failures & initiate shutdown |
| Log vision test failures to database |
| HARDWARE USED |
|---|
| Existing end-of-line tester |
| Test Fixture |
| (qty 2) Cognex camera |
| Lighting for camera |
| INTERFACES / PROTOCOLS |
|---|
| TCP/IP |
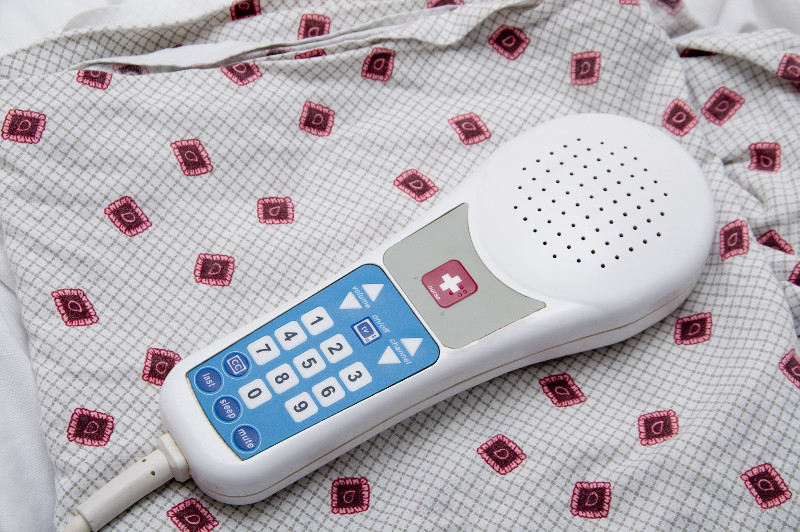
Automated Manufacturing Test System for Electronic Medical Devices
Automated Manufacturing Test System for Electronic Medical Devices
Using PXI and LabVIEW for modular testing of over 1,000 different models
Client – a medical device manufacturer and repair depot
Challenge
Our client manufactures hospital patient pendants used to control bed frame, nurse calling, and TV functions. The company was also growing after adapting a business model of being a repair depot for older designs for their own and the pendants of other manufacturers. As such, their products are very high mix and medium volume.
The basic functions for all these pendant models are closely related, so the client wanted a means to build a single automated test system that could verify functionality for 1000s of models. And, since the products are medical devices, the testers needed to comply to 21 CFR Part 820 and Part 11.
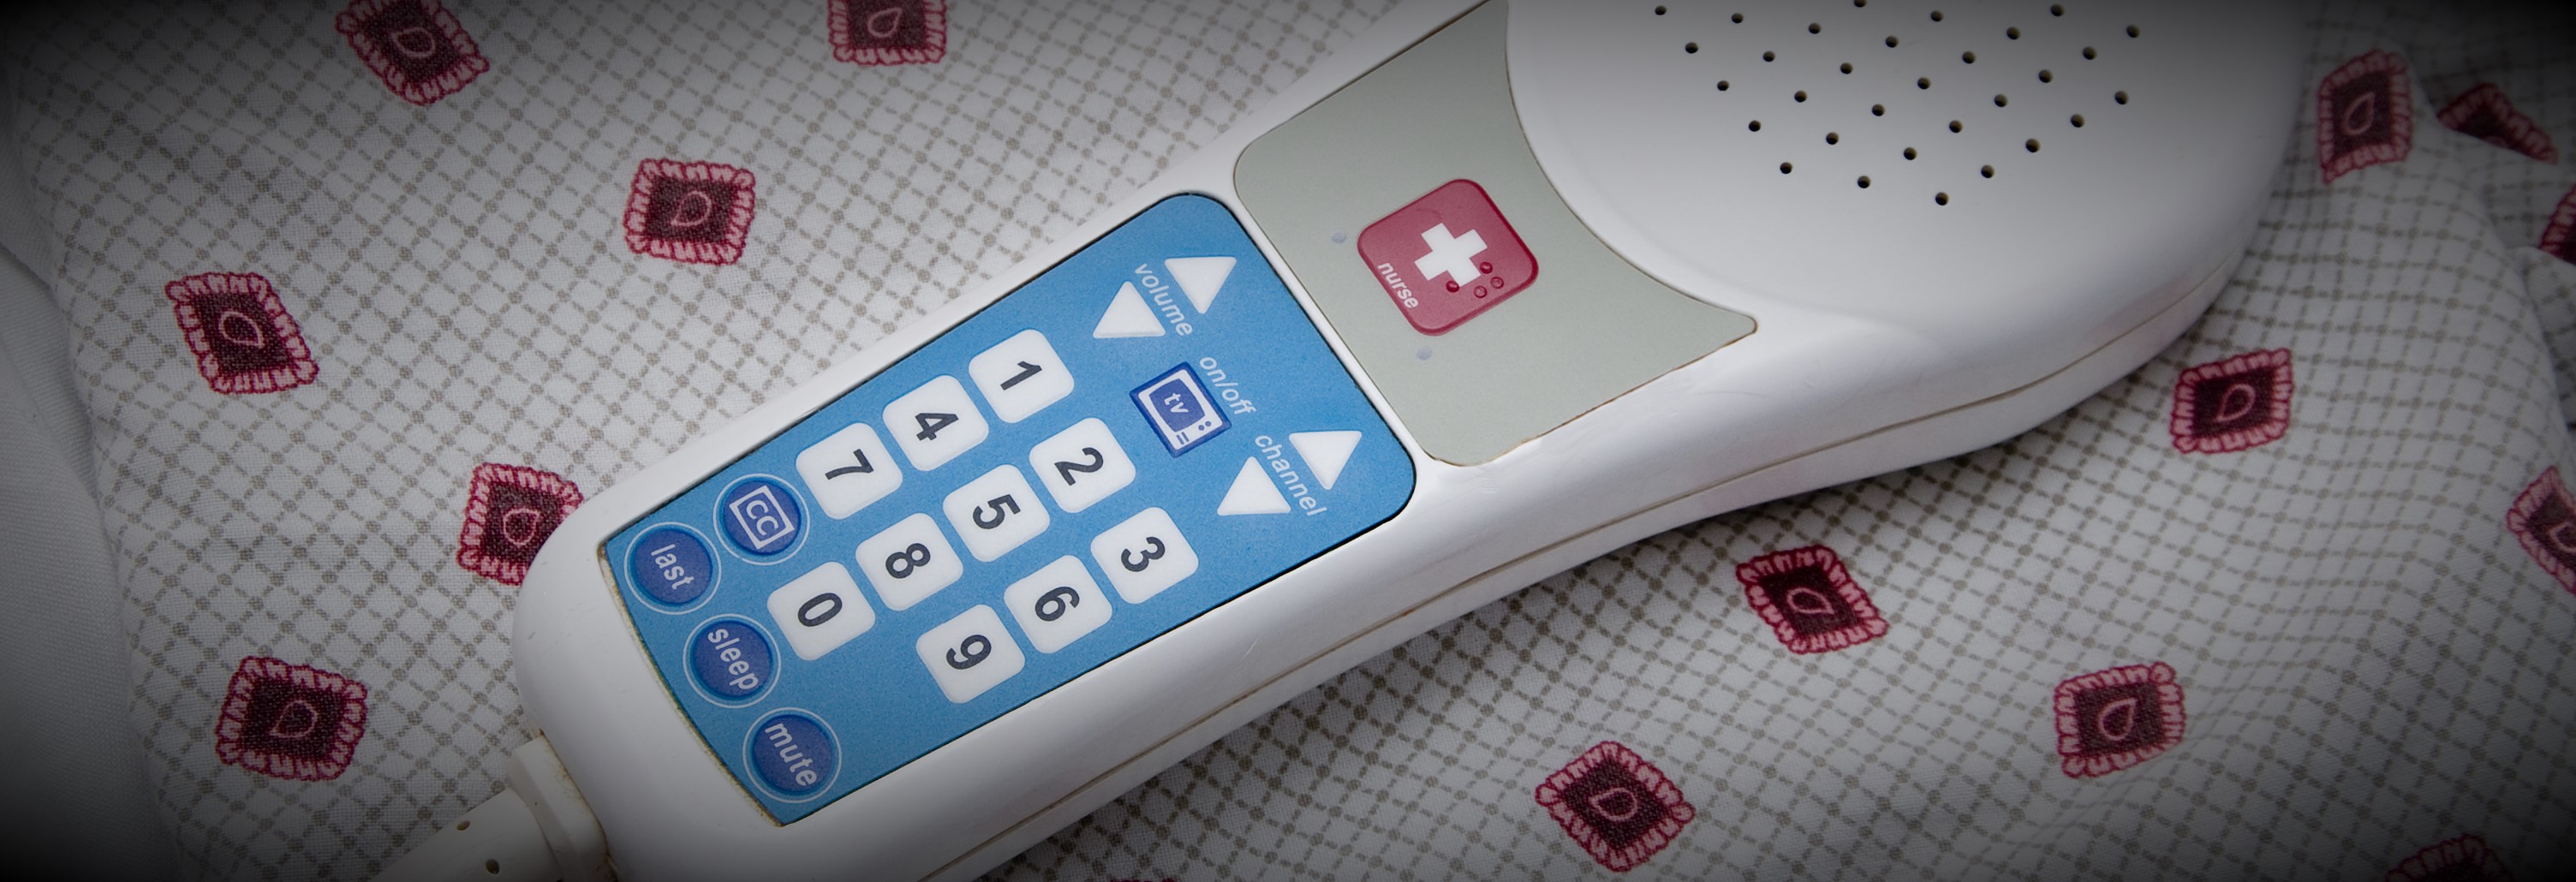
Solution
The testers were designed to support the common measurements needed to test the circuitry of the devices as well as the complex signals required to drive TVs and entertainment systems. A test sequence editor was created which allowed the client to create as many test sequences as needed to test each specific pendant model by creating a list from pre-defined basic measurement steps configured for each specific measurement.
For example, each device had a power supply, the voltage of which needed to be tested. To test a specific model, a voltage measurement step was added to the model-specific sequence and configured with the upper and lower measurement limits for the power supply. The complete test sequence was created by adding and configuring other measurements test steps as needed. Each test step could also be configured with switch configurations to connect the measurement equipment, such as a DMM, to the proper pins on the device circuit board.
Using this configuration process, the client was able to support the testing of well over 1000 models without any programming. A separate application was developed to create these test sequences which were saved as XML and fed to the test system for selection and execution.
The test execution was managed by NI TestStand and the pre-defined common test steps were written in LabVIEW. The test sequences and test results were interfaced to the client SQL database which they used in their ERP system. This ERP system used the results produced by the test system to help manage the workflow of production, for example by assuring that all units had passed testing before being shipped. Part 11 compliance was handled through checksums used to check if results had been modified.
Benefits
- Test sequence editor used to develop and maintain tests for 1000s of device models
- Enabling our client to create test sequences without programming reduced overall development costs by about 50%.
- Test sequences and test results were stored in the client’s ERP SQL-compliant database for integration with manufacturing workflow
- Modular and common software developed for the test systems reduced the V&V effort during IQ & OQ by allowing testing of the test execution application separate from the individual test sequences.
System Overview
The automated test system was able to execute each test sequence in three different modes: engineering, service, and production. Each mode has been specifically designed for various departments throughout the manufacturing floor. Typically, the manufacturing engineer would verify the sequence by executing it in engineering mode. Once the test sequence parameters pass, it was then approved for production testing.
During actual product testing, an approved and digitally-signed test sequence is loaded and executed via the test sequencer, designed for automated production. During execution, test results are displayed to the operator and simultaneously pushed to a database. The automated test system produces a record for each tested device, indicating the disposition of each test step and the overall performance of the device. All result data are digitally signed and protected from tampering.
The architecture of the test system follows a typical client–server model.
All client stations communicate with a central ERP and SQL server and each computer is secured by applying operating system security. The SQL server contains all of the test definitions, device history records and results. Information from it can be queried at any time by quality engineers throughout the organization, assuming they have proper login access. This provides real time status about products ready for shipment. Also, other than the software running on the client stations, no other user has permission to write or modify any information in this database. The client is able to keep the server in a protected area separating it from the manufacturing environment while the client test stations are placed throughout the manufacturing area.
Surprisingly, there were only twelve test steps needed to uniquely configure and be combined to create sequences to test well over 2000 unique models. Test steps are capable of measuring basic resistance, current and voltage parameters as well as perform sound quality measurements and high speed digital waveform analysis. Several tests were designed to be subjective while others are fully automated and test to a specified acceptable tolerance. During configuration, each test step requires the manufacturing engineer to enter expected values and tolerance limits to define pass – fail status. Upon testing, the devices are attached to a generic interface connection box and the test system makes the appropriate connections and measurements.
| SOFTWARE FUNCTIONS |
|---|
| NI TestStand |
| Low-level measurement drivers to interface to a DMM, signal generator, switches, and data acquisition cards. |
| Measurement-based test steps |
| Test sequence execution |
| Test sequence management |
| User access management |
| Test report creation and management |
| Verification of test sequence content and ability of user to execute |
| Verification of the content of the test results |
| HARDWARE USED |
|---|
| NI PXI chassis and controller |
| NI PXI acquisition cards for analog measurements |
| NI PXI acquisition cards for digital input and output |
| NI PXI DMM for precision voltage and resistance measurements |
| Audio amplifier for speaker tests |
| INTERFACES / PROTOCOLS |
|---|
| Ethernet |
*- images are conceptual, not actual
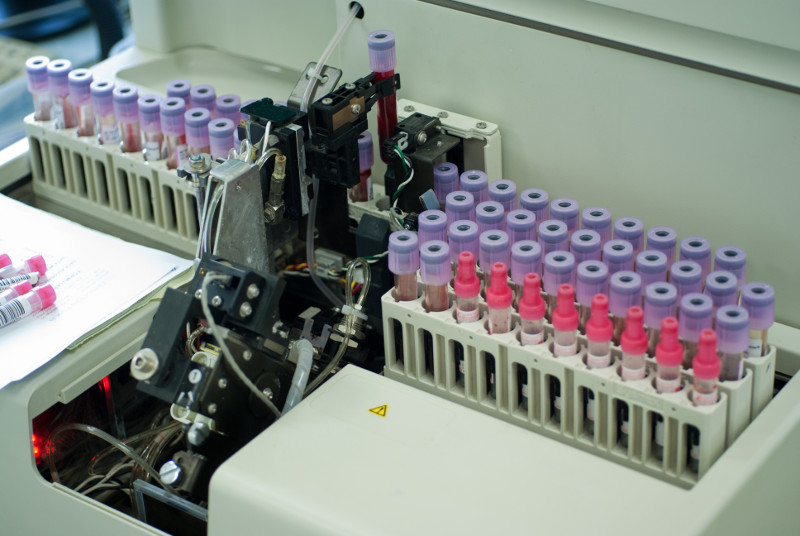
Automated Manufacturing Test Systems for Medical Diagnostic Equipment
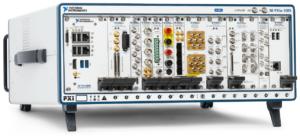
Automated Manufacturing Test Stands for Medical Diagnostic Equipment
Using NI PXI and LabVIEW as a common architecture for multiple test systems testing several subassemblies
Client: a manufacturer of automated blood analysis machines
Challenge
Our client was embarking on a complete redesign of their flagship automated in-vitro Class 1 blood diagnostic machine. In order to meet schedule goals, the design and build of several automated test systems needed to occur in parallel with the overall machine. In a major design paradigm shift, many components of the machine were being manufactured as modular subassemblies, every one of which was an electro-mechanical device. Thus, multiple testers were required to test each of the specific subassemblies in the machine. And, since this was a medical device, the testers needed to comply to 21 CFR Part 820 and Part 11.
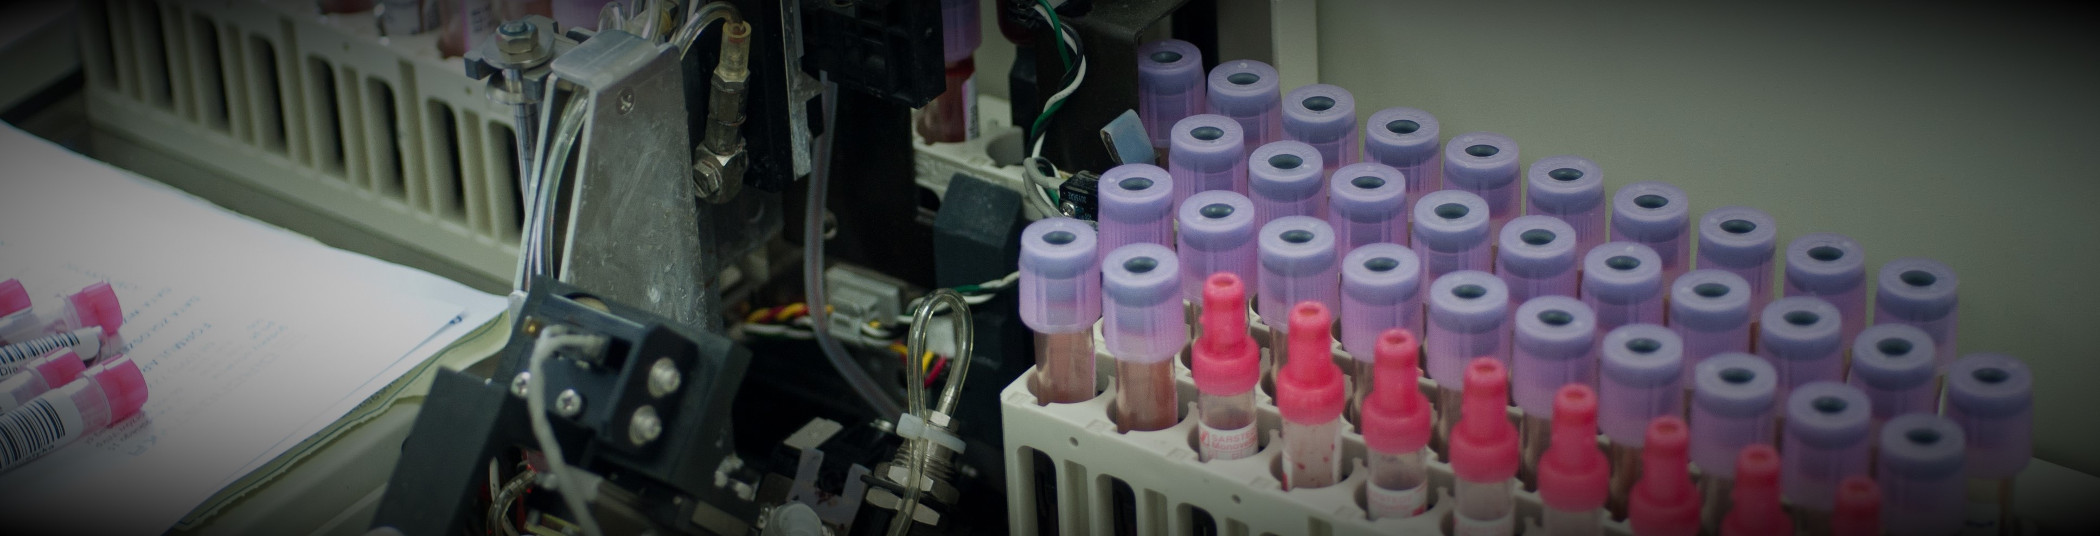
Solution
With a looming deadline, the testers needed a common architecture, so that all testers could leverage the development from the others. Since each subassembly could be tested independently of the overall machine prior to final assembly, the design of the testers was based on a common measurement and reporting architecture, written in LabVIEW, that interfaced to the customers Part 11 compliant database for testing procedures and measurement results. Furthermore, procedures and validation checks for calibration of the testers were part of the overall test architecture.
Benefits
- Modularization of the test system architecture aided development and maintenance
- Reduced overall development costs due to standardization of test sequence steps and reporting
- Both test sequences and test results were stored in a managed database that satisfied 21 CFR Part 11 requirements
- Modular and common software developed for the test systems reduced the V&V effort during IQ & OQ.
System Overview
Since multiple subassemblies were being tested, with one part-specific test system per part, the automated test systems used as much common hardware as possible to simplify the development effort through common hardware drivers and test steps. Test steps and the test executive that executed the test sequence(s) were developed using LabVIEW. Measurements were made with PXI equipment housed in a test stand along with support hardware.
The types of test steps required to verify the proper operation of each subassembly were categorized into basic operations, such as voltage reading, pulse counting, temperature reading, and communications with on-board microcontrollers. The specifics of each measurement could be configured for each of these measurement types so that each test step accommodated the needs of the specifics of each subassembly. For example, one subassembly might have needed to run the pulse counting for 2 seconds to accumulate enough pulses for accurate RPM calculation while another subassembly might have only needed 0.5 seconds to accomplish that calculation.
The configuration of a test step algorithm was accomplished via an XML description. The accumulation of these XML descriptions of each test step defined the test sequence run on that specific subassembly.
Test results were associated with these test sequences by completing the entries initially left blank in the test sequence, so that all results were explicitly bound to the test sequence.
The operator user interface distinguished between released and unreleased test sequences. With unreleased test sequences, engineers could try the most recent subassembly designs without needing to wait for final validation. The released sequences were only available to test operators. This login-driven branching was managed using the Windows login, so that the client employees could use their company badge-driven login process. Once logged in, the user would be able to execute the test sequence in automated mode, where all steps happen automatically, or manual mode, where one step could be operated at a time.
Furthermore, the Windows environment was locked down using built-in user account group policies to designate the level at which a user could access Windows or be locked into accessing only the test application.
V&V Effort
During the V&V effort, each test sequence was verified for expected operation, against both known good and bad parts. Once verified, the sequence was validated against the requirements and, when assured to be as expected, a checksum was applied to the resulting XML test sequence file and all was saved in a Part 11 compliant database. Upon retrieval, when ready to run a test, the sequence was checked against this checksum to assure that a sequence had not been tampered.
Test results, saved as XML in the same file format as the test sequence, were also surrounded by a checksum to verify that no tampering had occurred.
The IQ/OQ efforts were handled in a traditional manner with the client developing the IQ/OQ documentation, with our assistance, and then executing these procedures, again with our assistance.
| SOFTWARE FUNCTIONS |
|---|
| Low-level measurement drivers |
| Measurement-based test steps |
| Test sequence execution |
| Test sequence management |
| User access management |
| Test report creation and management |
| Verification of test sequence content and ability of user to execute |
| Verification of the content of the test results |
| HARDWARE USED |
|---|
| PXI chassis and controller |
| PXI acquisition cards for analog measurements |
| PXI acquisition cards for digital input and output |
| CAN card |
| INTERFACES / PROTOCOLS |
|---|
| Ethernet |
| CAN |
*- images are conceptual, not actual
Endurance and Environmental automated test system for electro-mechanical sub-system
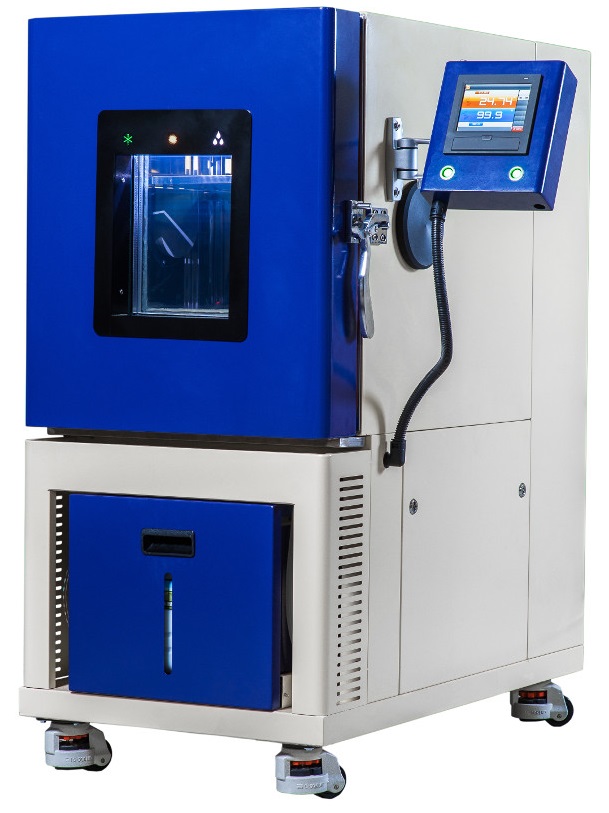
(image is representative, not actual)
Endurance and Environmental automated test system for electro-mechanical sub-system
Automating tests that run for weeks at a time
Client – Automotive component supplier
Challenge
Our client was already doing validation, but it was manual, and the client’s customer started requesting faster turnaround of results. Their customer was also requesting data to be sent with the results. Our client chose to automate the validation process to enhance their productivity.
Solution
Viewpoint utilized the (mostly) existing hardware from the manual tester and developed software to automate the testing. The LabVIEW-based automated test system allows for endurance & environmental validation testing of an electro-mechanical sub-system.
Benefits
- Automates tests that run for weeks at a time
- Logs errors during the test (e.g., for continuous monitoring tests, logging the number of instances of when a UUT’s LIN (Local Interconnect Network) response deviates from a static, current draw outside of limits)
- Capable of testing a large variety of product lines
- Logs pertinent data to a database for post-test analysis/inclusion into reports
System Overview
The UUT is an electro-mechanical part that falls under a variety of different product lines. As such, the client had a couple variants of the tester, based on the communication needs of the UUT. A total of more than a dozen testers were deployed. The functionality of the tester evolved over time, specifically modifying software to make the tests faster / decrease cycle time.
| SOFTWARE FUNCTIONS |
|---|
| Extensive diagnostic/manual operation of system for debug of software and electrical connections between the UUT and the test stand/tooling. |
| Product-specific software components to operate unique products. |
| Execute mechanical endurance tests. |
| Execute environmental endurance tests. |
| Database output containing results from every test cycle (either mechanical cycles or time depending on test being run). |
| HARDWARE USED |
|---|
| USB-LIN module |
| USB and PCI CAN Interfaces |
| Analog input card |
| Digital Input card |
| Digital Output card |
| Power Supplies |
| DMMs |
| Switch Matrix |
| INTERFACES / PROTOCOLS |
|---|
| CAN |
| LIN |
| USB |
| GPIB |
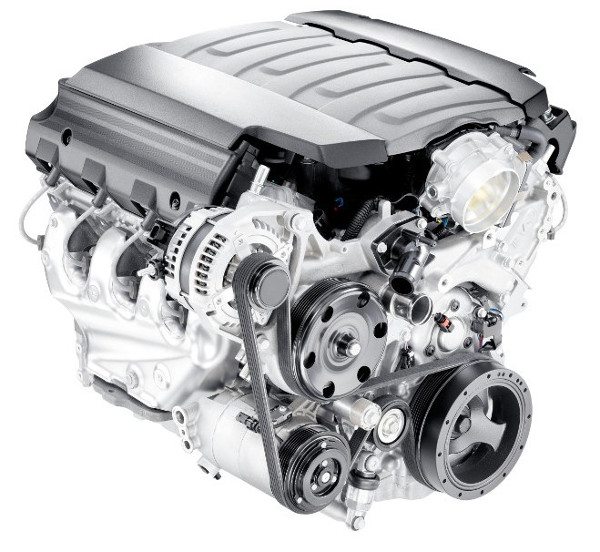
Product Validation of Mechanical Subsystem with NI cDAQ
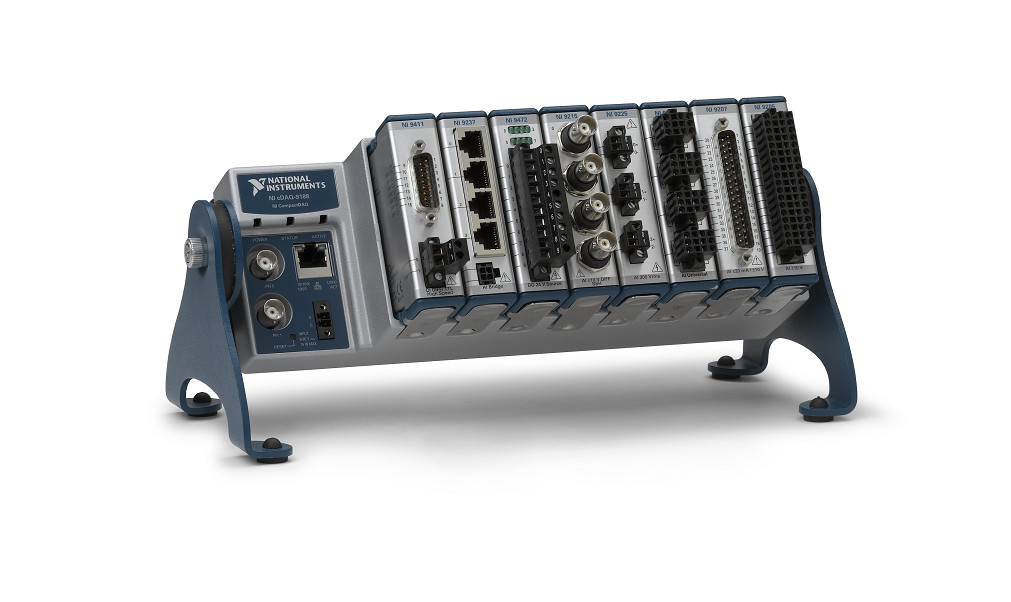
Product Validation of Mechanical Subsystem with NI cDAQ
The updated product validation tester automates long tests, allowing the client to prove more obviously that their part met the specification.
Client – Automotive Component Supplier / Manufacturer
Challenge
The client already had a test system in place, but it was old and was becoming unmaintainable. Increasing demands from the test engineers and the old software architecture not lending itself to clean implementation of these new features (new sequencer capabilities and ECU CAN communication) drove the need for a rewrite of the software application.
Solution
The updated product validation tester supports product validation of the UUT by automating long tests (sometimes a week or more) providing the desired set point control, allowing the client to prove more obviously that their part met the stated specification. Viewpoint developed the software and the client selected the hardware.
Benefits
- Automate long duration tests
- Improved operator UX by making controls and indicators more intuitive to the user as well as providing additional capability within one application.
- Acquire ECU data along with measured UUT data to allow for engineering performance characterization analysis
- Playback utility enables the Test Engineer to quickly view collected data to chart out a path forward for further testing.
- Automate a Design of Experiments matrix of conditions, through new sequencer capabilities, to more quickly arrive at product characterization parameters.
- All collected signals are now housed in one TDMS file instead of multiple files from different applications.
System Overview
The UUT is a complete engine with a focus on one of the mechanical subsystems. Data is collected on over 100 channels, measuring temperature, vibration, strain, RPM, position and pressure. Engine management data (e.g., component location, pressures, engine speed, and status flags) is collected via CAN. The engine speed is set via an analog output, and subsystem setpoints are sent to the ECU via CAN. SCXI still used on some of the old test stands, but is being phased out in favor of cDAQ. The test system software was developed in LabVIEW.
| SOFTWARE FUNCTIONS |
|---|
| Test Sequencing |
| Data Visualization |
| Data Collection |
| Setpoint Control |
| HARDWARE USED |
|---|
| NI cDAQ |
| NI C Series Digital input module |
| NI C Series Digital output module |
| NI C Series Digital input/output module |
| NI C Series analog output module |
| NI C Series temperature input module |
| NI C Series analog input module |
| NI C Series strain/bridge module |
| INTERFACES / PROTOCOLS |
|---|
| Ethernet (TCP) |
| CAN |
LabVIEW-based Data Logger for Product Validation of Commercial Equipment
LabVIEW-based Data Logger for Product Validation of Commercial Equipment
Synchronizing data from multiple data logging instruments
Client – Manufacturer of commercial equipment
Challenge
The client already had a method in place to log data needed for validation testing. However, this data was acquired from multiple independent data logging applications. They needed something to aggregate the data and align/synchronize the data across multiple instruments.
Solution
Viewpoint developed a LabVIEW-based product validation solution that continued to utilize the existing data logging hardware, but uses software to aggregate & synchronize the data from multiple sources. This simplifies post-processing.
Benefits
- Synchronized & aggregated data from multiple instruments
- Ability to add capability for new instruments later on
- Real time graphing of all channels
- Channel averaging across multiple instruments
- Ability to save data acquisition configurations for future use
- Faster channel configuration than current data logging applications
System Overview
The data logging software unifies the collection of data for a particular validation test. The software configures each instrument, kicks them off, logs the data to a TDMS file, and also graphs data and displays real-time values.
| SOFTWARE FUNCTIONS |
|---|
| Instrument configuration |
| GUI |
| Data Acquisition |
| Data Synchronization |
| Data Logging |
| Multi-channel averaging |
| HARDWARE USED |
|---|
| Keysight Data Logger |
| Fluke Data Acquisition DMM |
| INTERFACES / PROTOCOLS |
|---|
| RS-232 |
| USB |
| Ethernet |
Endurance Testing using NI PXI
Endurance Testing using NI PXI
An automation test stand permits faster validation, unattended test, an increase in throughput, and can free up resources for other tasks during the weeks long endurance test.
Client – A manufacturer of aircraft components in the mil-aero industry
Challenge
New product development drove the need for a new aerospace endurance test stand for product validation. The old systems were not designed to test the newly designed part (aircraft actuators), and the company didn’t have the time or resources to reconfigure existing systems to perform the testing required.
Solution
The new PXI-based endurance test stand provides automated electromechanical testing, full data recording, report generation and a diagnostic panel for intelligent debug. Viewpoint selected the NI equipment while the test stands and other components were selected and fabricated by the customer.
Benefits
- This automated aerospace test stand permits faster validation, unattended test, an increase in throughput, and can free up resources for other tasks during the weeks long endurance test.
- Full data recording with a data viewer enables post analysis, which provides the ability to review and analyze raw signals captured during execution. Channel examples are actuator LVDT position, load, current, and encoder actuator position.
- Summary report capability allows the customer to document the amount of testing completed against the full endurance test schedules.
- A manual diagnostic operational panel provides the ability to verify particular DUT functionality or components without running an entire schedule.
- Systems can be paused and restarted to allow for “scheduled maintenance” of the DUT such as inspections, lubrication, etc.
System Overview
The PXI-based aerospace endurance test stand enables data collection, deterministic PID Loop Control, emergency shutdown and a diagnostic panel for manual test and debug operation. The system runs endurance test schedules, that are defined as a recipe for test execution. These schedules, which are customer-defined and DUT-specific, are designed to simulate the actual conditions the DUT would see in real world application as closely as possible. LabVIEW-RT was used for the deterministic looping for Closed Loop Control of Actuator Position and Load Control. LVDT demodulation was performed on a PXI FPGA card programmed with LabVIEW FPGA.
| SOFTWARE FUNCTIONS |
|---|
| GUI |
| Summary Reports |
| Full Data Collection for Real-Time and Post Analysis |
| Deterministic PID Loop Control |
| E-Stop Management |
| Diagnostics Panel for Manual Test and Debug |
| Endurance Test Schedule Execution |
| Hydraulic Control Panel for Source & Load PSI Control |
| HARDWARE USED |
|---|
| Test stand for PXI hardware and cable connectors |
| PXI |
| Various PXI-based data acquisition cards |
| PXI RT controller |
| PXI FPGA card |
| INTERFACES / PROTOCOLS |
|---|
| TCP/IP |
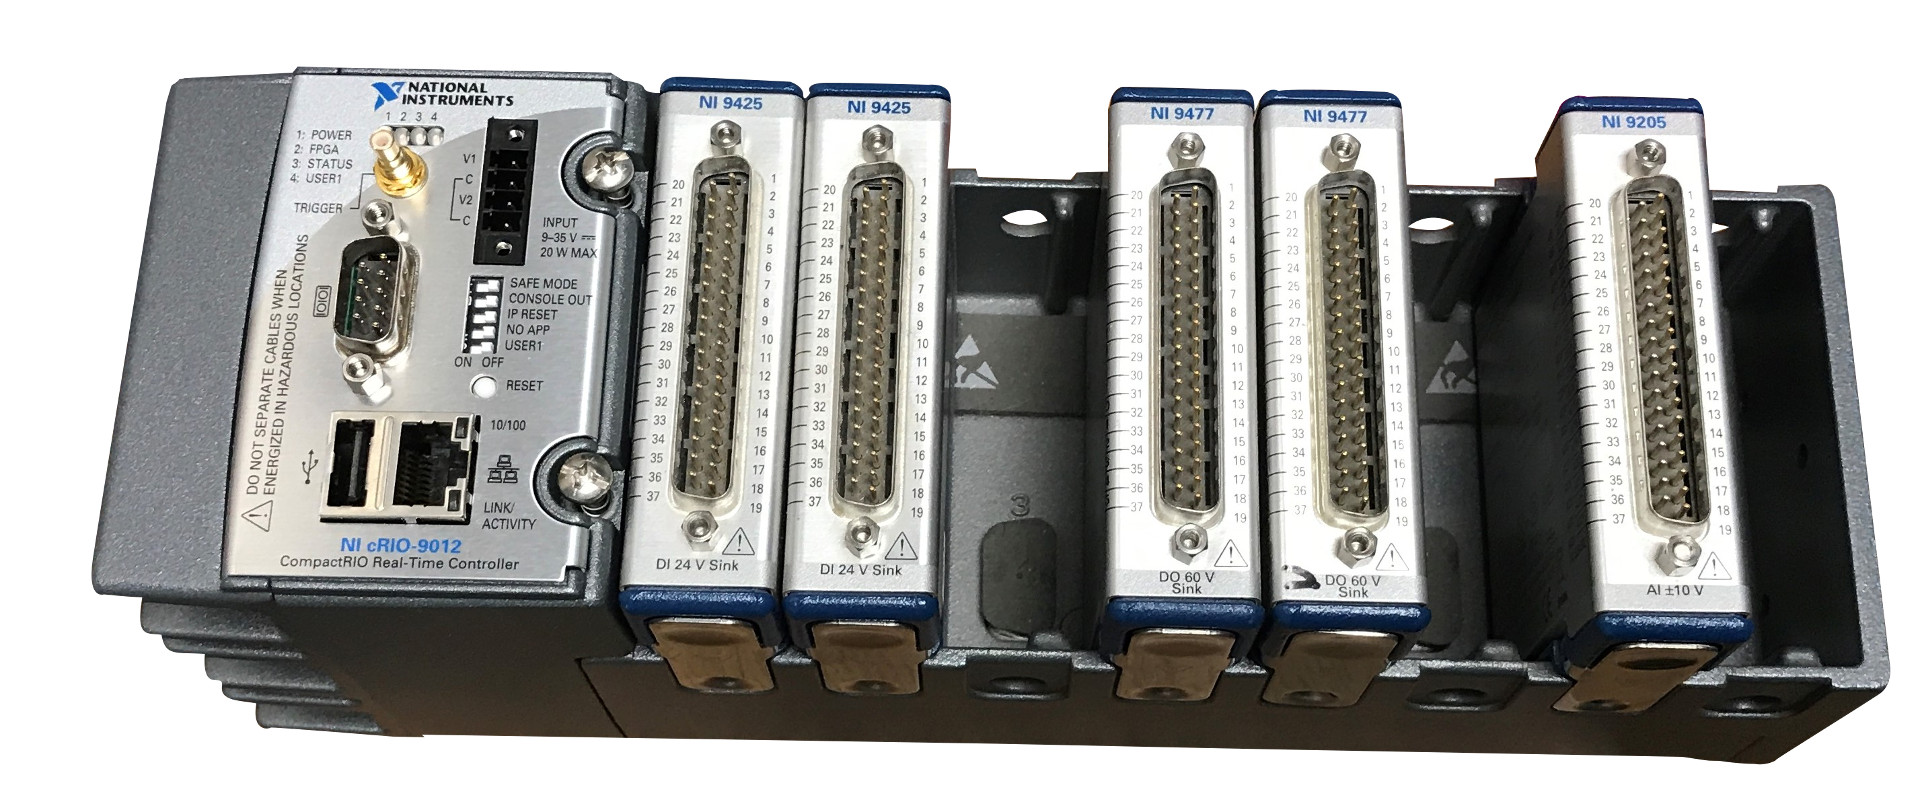
Endurance Tester for Mission-Critical Mechanical Component using NI cRIO
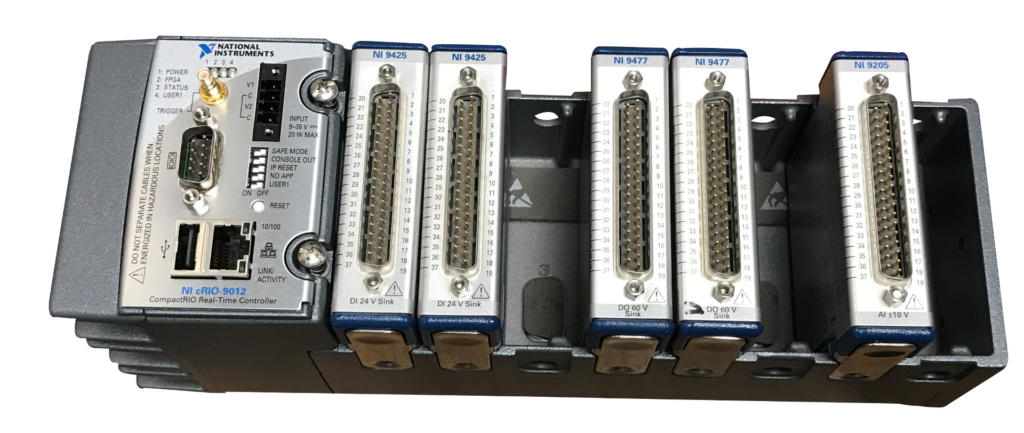
Endurance Tester for Mission-Critical Mechanical Aerospace Component using NI cRIO
Ability to run tests unattended and overnight reduces operator labor and compresses test schedules
Client – Major Aerospace Component Supplier / Manufacturer
Challenge
The client had an older VB & PLC-based aerospace test bench in place already, but it was obsolete. A new endurance test bench needed to be developed to validate prototyped components (in this case, aircraft & aerospace bearings). Many of the prototypes are one-off, so it was important that the test system not destroy the component.
Solution
A new endurance test bench was developed to validate prototyped aerospace components. The test bench can be configured for automatic shutdowns so as not to destroy the component under test in the event of unexpected performance of electro-mechanical subsystem components. The updated endurance tester supports product validation by allowing the product to run under various test conditions (e.g. speed, load, oil flow, temperature) and collecting data for analysis.
Viewpoint developed the software and selected the NI hardware (other hardware was selected by the client).
Benefits
System Overview
The updated cRIO-based endurance tester incorporates configurable profiles, data logging, and automatic shutdown to allow for safer extended validation testing. LabVIEW FPGA and LabVIEW RT were used together to interface with the test hardware sensors and controls. LabVIEW as used create the HMI for the test system.
| SOFTWARE FUNCTIONS |
|---|
| Closed loop control of bearing test oil flow |
| Axial load control |
| Driver for Emerson VFD |
| E-Stop and safety management (shutdowns based on alarm limits) |
| Data collection – temperature, pressure, flow, vibration, frequency |
| Operator/Diagnostic GUI for control of system |
| HARDWARE USED |
|---|
| NI CompactRIO (cRIO) |
| NI C Series Current Input Module |
| NI C Series Voltage Input Module |
| NI C Series Temperature Input Module |
| NI C Series Current Output Module |
| NI C Series Analog Input Module |
| NI C Series Sound and Vibration Input Module |
| NI C Series Digital Module |
| Emerson VFD (Variable Frequency Drive) |
| INTERFACES / PROTOCOLS |
|---|
| TCP/IP |
| TCP Modbus |
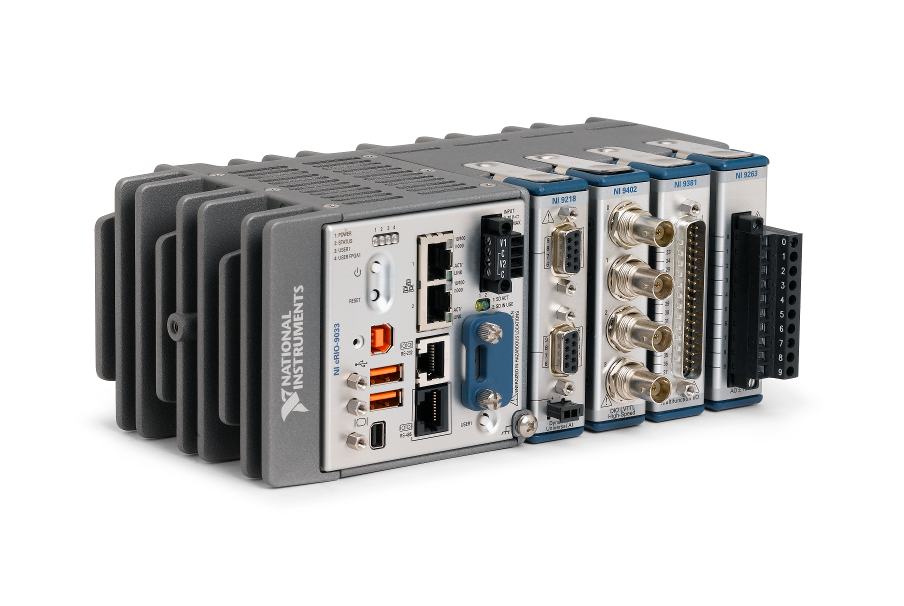
Endurance Tester using NI cRIO
Endurance Tester using NI cRIO
Multiple International Deployments Helps Prove Product Meets Spec.
Each endurance test can run upwards of 6 months.

Client: Major Automotive Component Supplier
Challenge
A new endurance test system was developed to give more precision in the control setpoint. This additional precision enabled potential clients to review the product performance in real-life situations. Each endurance test can run upwards of 6 months.
Solution
The updated endurance tester supports product validation by providing the desired parameter control method, allowing the client to prove more obviously that their part met the stated specification.
Viewpoint developed the software and selected the NI hardware for the first unit. The client is now deploying copies of this system to multiple international manufacturing plants.
Benefits
- Able to prove meeting a particular product specification of interest
- Closed loop parameter control
- Data collection
- Configurable Alarms
- Emergency shutdown functionality
System Overview
The cRIO-based endurance tester provides closed loop control, data collection, and alarming with controlled and emergency shutdown functions. The operator can manually configure a test or load a saved configuration. After a manual operator check to make sure the setup is operating correctly, a successful test will run its full duration and stop on its own.
| SOFTWARE FUNCTIONS |
|---|
| Touch PC interface / GUI |
| Closed loop parameter control |
| Data collection |
| Controlled & emergency shutdown |
| Alarming |
| HARDWARE USED |
|---|
| NI CompactRIO |
| NI analog input cSeries module |
| NI analog output cSeries module |
| NI digital input cSeries module |
| NI digital output cSeries module |
| INTERFACES / PROTOCOLS |
|---|
| TCP |
Product Validation using LabVIEW RT & LabVIEW FPGA – Electromechanical Actuator Test Stand
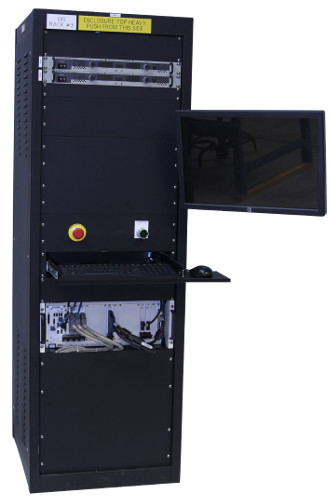
Product Validation using LabVIEW RT & LabVIEW FPGA – An electromechanical test stand for an aerospace actuator
Automated testing reduces operator man hours and increases production throughput.
Client – A manufacturer of actuators in the mil-aero industry.
Challenge
New Product Introduction (in this case a new controller and new actuators) drove the need for a new aerospace electromechanical test stand.
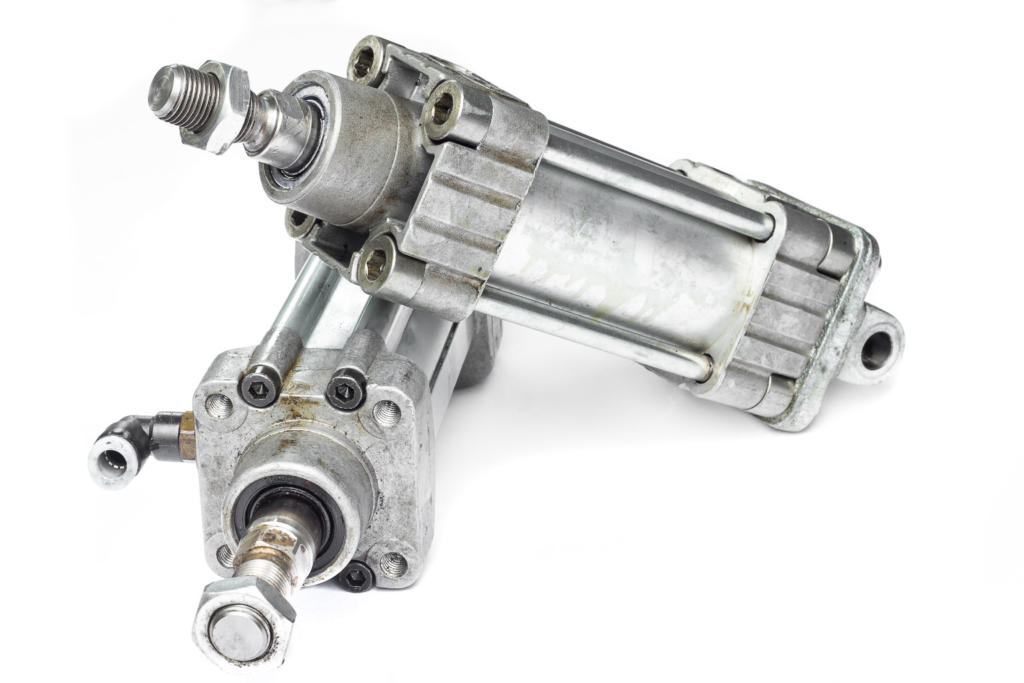
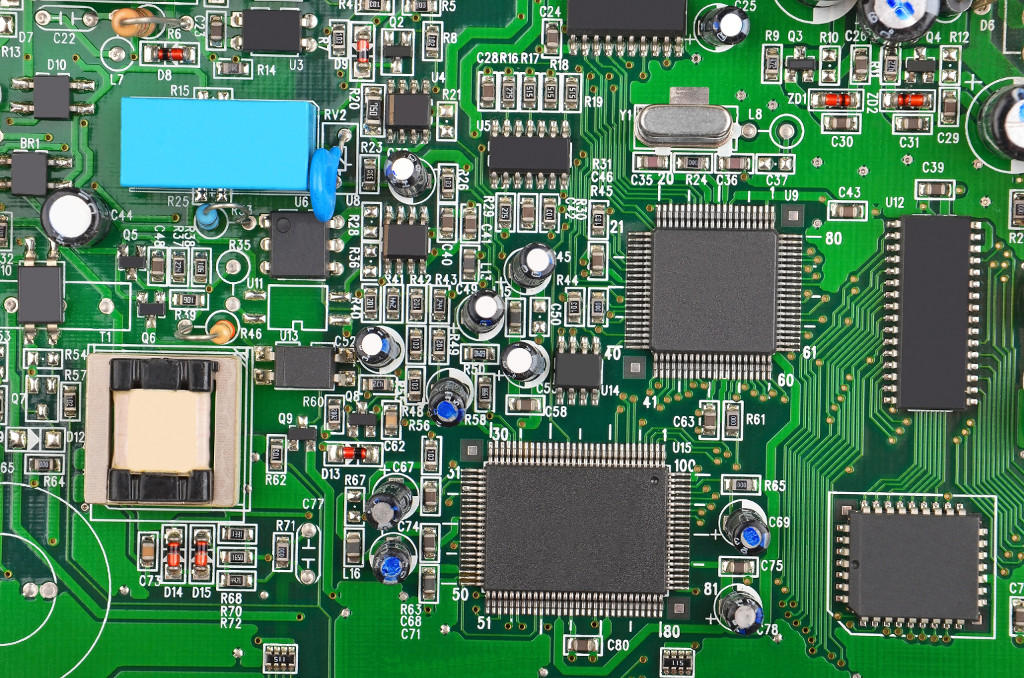
Solution
New NI PXI-based electromechanical test equipment provided automated HIL testing, report generation, and SPC data generation. The sequencing of the test procedure, reporting, and verifiable results were managed with the StepWise test executive platform.
Benefits
- Automated testing reduces operator man hours and increases production throughput.
- Meets strict customer requirements regarding testing and data recording in a verifiable manner.
- Automated Test Report Generation.
- Collects data to support SPC (Statistical Process Control).
- Ability to interact with the internal state of the controller FPGA via the LVDS communication link.
System Overview
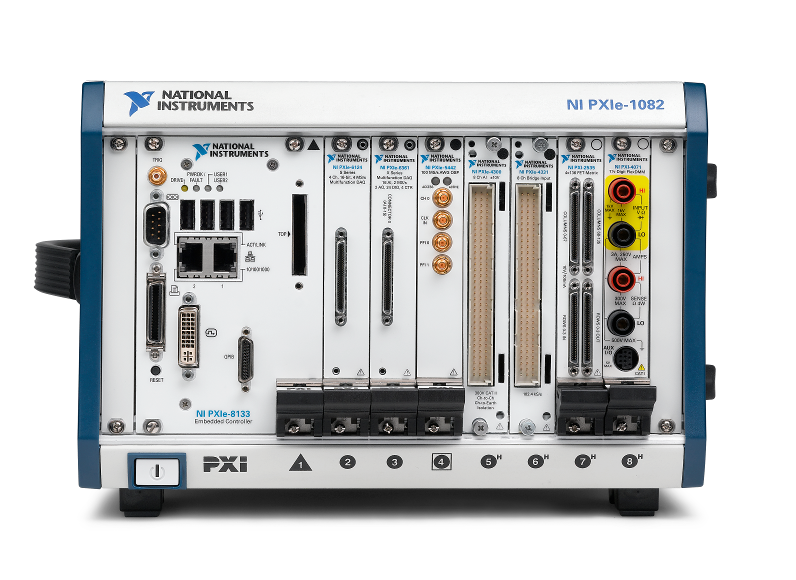
Viewpoint developed the software and selected NI data acquisition and control hardware for the test stand. There are several layers of software functionality. Also, the modularity of the test stand hardware assures maintainability for future upgrades and reduction of potential obsolescence issues, especially since the “programmability” of the FPGA-based HW allows repurposing via LabVIEW FPGA.
| HOST LABVIEW SOFTWARE LAYER |
|---|
| Test sequencer |
| Test steps (e.g. Frequency Response, Step Response, Dynamic Stiffness, Fault Response, Power Consumption) |
| Test Report Generator |
| GUI |
| REAL-TIME (RT) LABVIEW SOFTWARE LAYER |
|---|
| Data acquisition |
| 1553 comms |
| Function generator |
| Error detection |
| ESTOP |
| LABVIEW FPGA SOFTWARE LAYER |
|---|
| Synch data from 3 sources (tester, UUT, external DAQ device) |
| Stream high-speed data to disk |
| Stream high-speed data to analog outputs for HIL test |
| Custom communication protocol used by UUT over LVDS lines |
| HARDWARE RECOMMENDED |
|---|
| NI PXIe |
| NI FlexRIO card with LVDS adapter module |
| Multiple NI R Series cards |
| High speed, high voltage, isolated analog input cards |
| INTERFACES / PROTOCOLS |
|---|
| MIL-STD 1553 bus |
| LVDS |
| Ethernet |
| Custom TCP/IP |
*- images are conceptual only, not actual
Creating an N-Up Tester to handle increased production volume demands
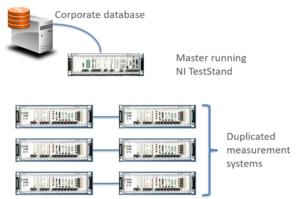
Creating an N-Up Tester to handle increased production volume demands
Enhanced throughput offers ROI payback period of less than 1 year
Client
Automotive Components Supplier / Manufacturer
Challenge
The company makes automotive components in very large volume, several part models each at more than 1 million per year.
The client’s primary concern was conserving floor space. They were completely out of spare manufacturing space.
Solution
Viewpoint created an N-up NI PXI-based Manufacturing Test System. In this case, N=6 because analysis showed that a 6-up electronic part tester allowed the test operator to cover the test time with the load/unload time.
At the high volumes needed, the client needed to parallelize as much as possible. The cost of 6 sets of test equipment and device sockets was less important than speed. Using the equation:
ProfitPerUnit x NumberAdditionalPartsPerYearAfterParallelizing > CostOfTestEquipment,
being able to completely parallelize made the number of extra units per year large enough that the payback time for completely duplicating the measurement instrumentation for each UUT socket was less than about 1 year.
Benefits
- Paid for itself in less than 1 year by the enhanced throughput.
- This approach consumed about 20% the floor space that would have been used for duplicating the test system 5 more times (for a total of 6 testers)
System Overview
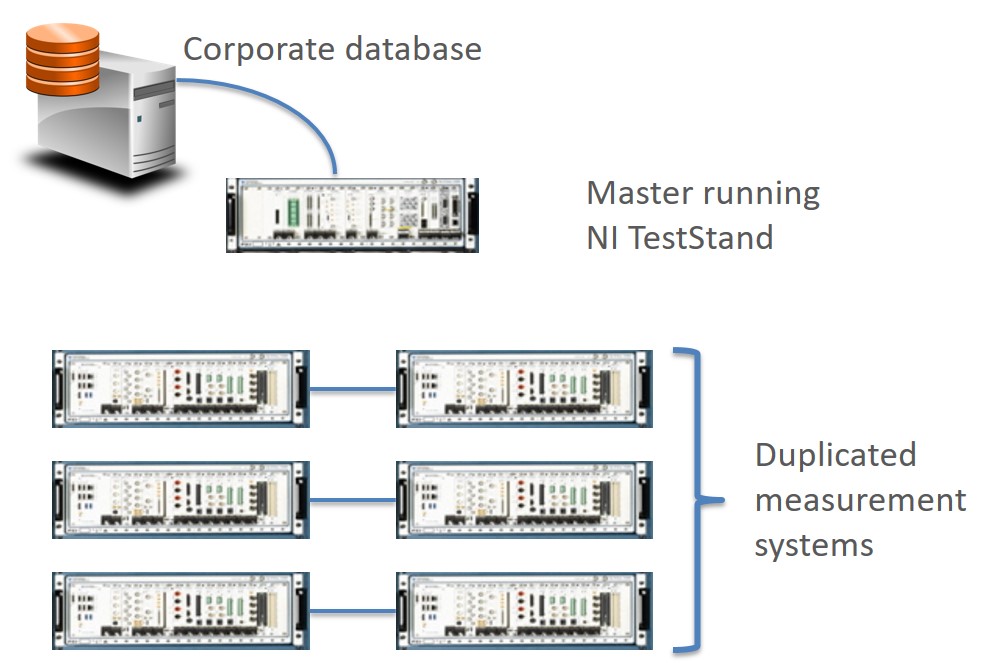
Viewpoint developed an NI TestStand application that ran 6 instances of the test sequence independently of each other utilizing the duplicated PXI-based test equipment. The common parts of the overall master sequence were:
- Startup check for the entire test stand
- Shutdown of the entire test stand
- Archiving the test results into the database
Part handling was managed by a PLC and robot which delivered the parts from a tray into the UUT sockets. Digital bits were used for signaling the test sequence which parts were present in their sockets and ready to test.
| SOFTWARE FUNCTIONS |
|---|
| Test System GUI |
| Test sequencer |
| Startup checker |
| Test Results Archiver |
Increasing Test System Automation for Existing Tester to handle Production Volume Demand Increase
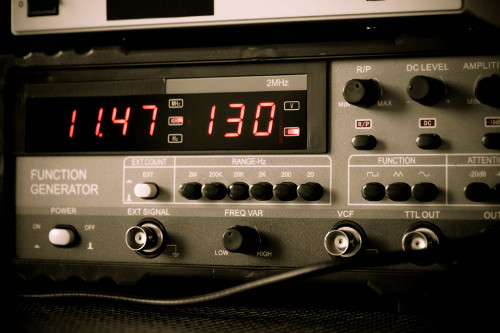
Increasing Test System Automation for Existing Tester to handle Production Volume Demand Increase
Reduced test time across several products by an average of ~25% and reduced time to create paperwork by ~3x
Client
Manufacturer of high-voltage power supplies
Challenge
The client already had an existing manufacturing test system in place. They wanted Viewpoint to enhance the tester due to an increase in production volume demand. Viewpoint reviewed the existing test system and noted 3 areas for improvement:
- Automation available in the measurement instruments – most of the test equipment was automatable, via some combination of serial, GPIB, or Ethernet interfaces. Furthermore, some equipment, such as an oscilloscope, had the ability to store and recall setup configurations. The test operators already used these configurations to decrease setup time for the next test step. Most test equipment did not have automated setup.
- Operator time spent on each test step – the client had been through a Lean assessment and had already done a good job of timing operations. However, we specifically noted that the operator was manually connecting to the test points and manually transcribing to paper the measurement results from instrument displays.
- Automating the connections – many types of product models were being tested at this test system. Connecting the test equipment to all sorts of products would require either 1) many types of test harnesses and connectors or 2) a redesign of the products to make test connections simpler and quicker.
Solution
The enhanced automated test system included automation of instrumentation interfaces, a test executive to run the test sequences, automated test report generation, and automated test data archiving for the electronic UUT.
Benefits
- Reduced total test time across several products by an average of ~25%.
- Time to create paperwork was reduced by ~2/3 due to automated data collection.
System Overview
The enhanced test system included the following updates:
- Test sequence automation
- Automated test report generation
- Automated test data archiving
- Automation of instrumentation interfaces
- Configurable automated test steps associated with each type of measurement instrument. The test operators would create a sequence of steps to setup each instrument and record the resulting measurement. The sequence of steps could be saved and recalled for each product to be tested, so the instruments could be used automatically.
- New programmable meter – integrated the new DMM meter with a programmable interface to replace the one that was not automatable.
- Foot switch integration – Since the connections to the test points were manual, a foot switch allowed the operator to take the measurement and advance to the next step.
The StepWise test executive platform managed the multiple test procedures created for the different products. StepWise also handled creation of HTML reports for every part tested.
| SOFTWARE FUNCTIONS |
|---|
| Test GUI |
| Test Sequencer |
| Report Generator |
| Test Data Archiving |
| Instrument interfaces |

Product Validation & Production Test System – For complex Mission-critical sub-system
Product Validation & Production Test System – For complex Mission-critical sub-system
Client
Ensign-Bickford Aerospace & Defense

Upgrade reduces per unit test time by ~40% and improves reliability of software
Challenge
The customer needed to upgrade their existing test system. Their old test system was very manual:
- It did not provide ability for unattended operation
- The thermal control had to be set manually
- They wanted to do less manual review of the data
The client develops mission-critical products, so there’s a desire to reduce manual operations because they have to explain any anomalies, and manual operations are typically more error-prone. They needed repeatable results that they could trust.
Solution
Viewpoint developed a new test system that utilized new hardware and software, augmented by existing low level hardware and firmware. The test system was developed to perform both functional test for production and environmental testing, and was designed to handle up to 4 DUTs at once. The test system utilizes the StepWise test executive software with custom test steps, which allowed the client to create their own highly configurable test sequences. The system was developed in two phases, with the second phase adding support for a FPGA expansion backplane (NI CompactRIO chassis) in order to provide future capability for bringing some of the microcontroller sequence activity into the NI space. In addition, the previous version had a mix of serial, TTL, and USB instrumentation, which was not as robust as Ethernet based instrumentation. Phase II involved upgrading to all Ethernet based instrumentation, and did away with the original test system’s many manual toggle switches that could be used instead of the programmable mode through the SW.
Benefits
- ~40% test time reduction per unit
- ~25% reduction in anomalies that needed to be justified
- ~500 manhours saved in test execution
System Overview
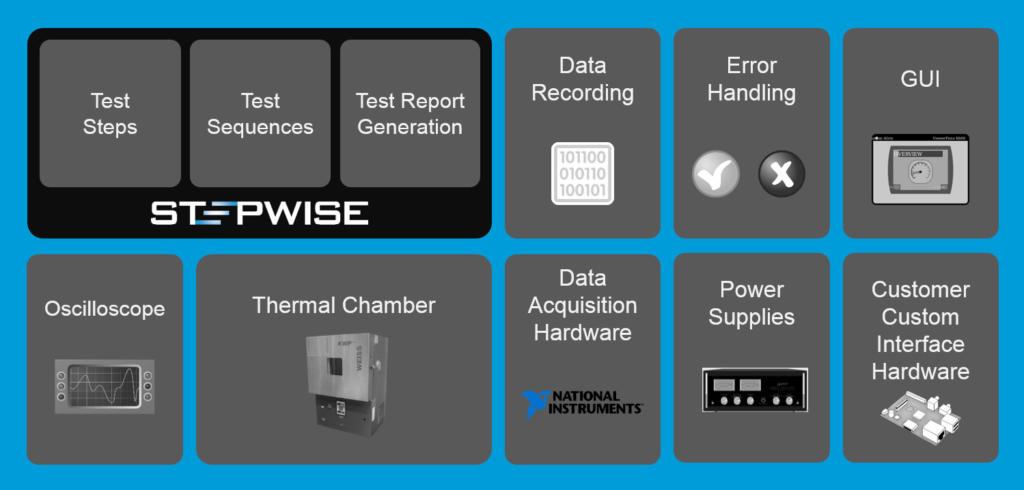
| Software Functions |
|---|
| Test sequencing |
| Test report generation |
| Data recording/logging |
| Error handling |
| Test GUI |
| Oscilloscope interface |
| Thermal chamber interface |
| Power supply interface |
| External custom hardware interface |
Manufacturing Test Data Logger
Manufacturing Test Data Logger
Data Acquisition System Facilitates Continuous Improvement of Product Performance
Client – A manufacturer of welding consumables

Challenge
Our client produces welding consumables. These products are inspected for continuous improvement of product performance. Our client wanted to standardize their data collection method to improve product quality and utilize SPC (statistical process control) across multiple international manufacturing facilities.
Solution
The solution is a relatively straightforward data acquisition system measuring force, vibration and voltage for comparison across multiple international manufacturing facilities to support continuous improvement of product performance.
Benefits
- Standardization of data collection across multiple manufacturing sites
- Ability to check product performance tolerances, which could trigger root cause analysis
- Ability to analyze data across product runs and across sites for SPC
System Overview
The system utilizes off-the-shelf data acquisition hardware from National Instruments along with custom LabVIEW code to perform force and vibration measurement and basic calculations such as RMS Min and Max. Each test generates an MS Word file showing summary data as well as graphs of each attribute over time. In addition, the program creates (and automatically archives) a complete data set of all data recorded during the trial and finally adds a line with all the summary results and comments to a Master log file. This Master log file can then be sorted by date, wire type, diameter, or any other input for analysis.
| SOFTWARE FUNCTIONS |
|---|
| Calculations (e.g. standard deviation, RMS, Max) |
| GUI for configuration, control, and results. |
| Automated Report Generation |
| HARDWARE USED |
|---|
| NI cDAQ |
| NI C Series voltage input module |
| NI USB Multifunction I/O Device |
| INTERFACES / PROTOCOLS |
|---|
| USB |
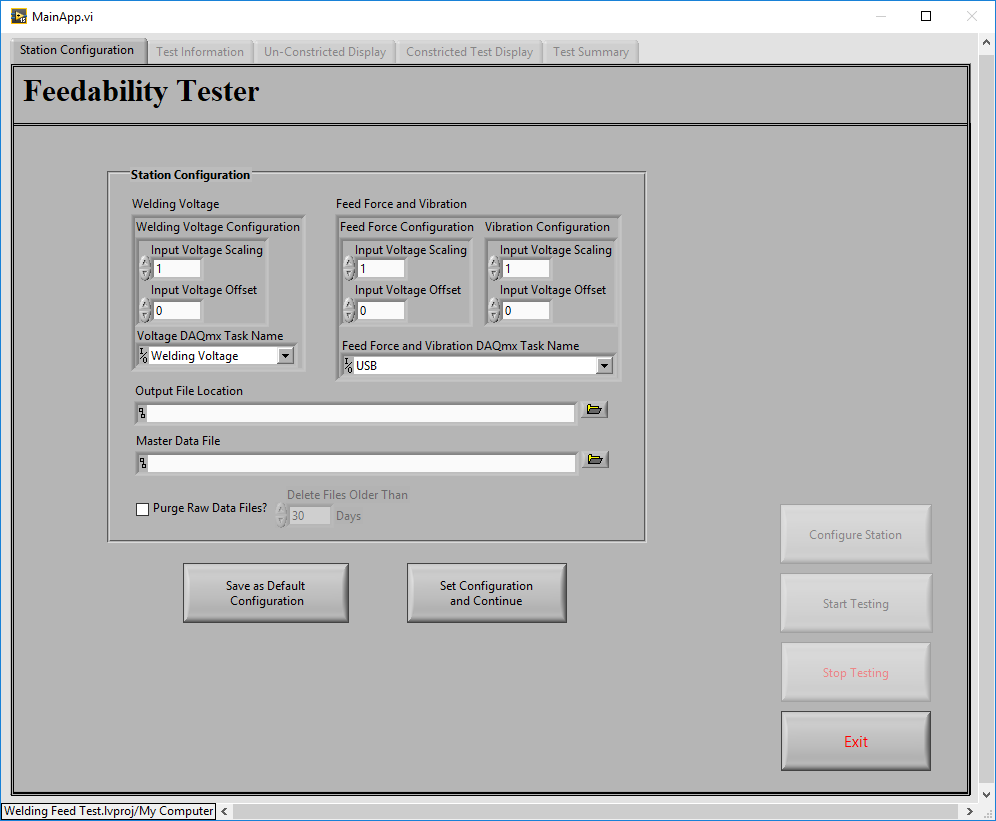
Custom Manufacturing Inspection System – with Machine vision and Advanced Motion Control
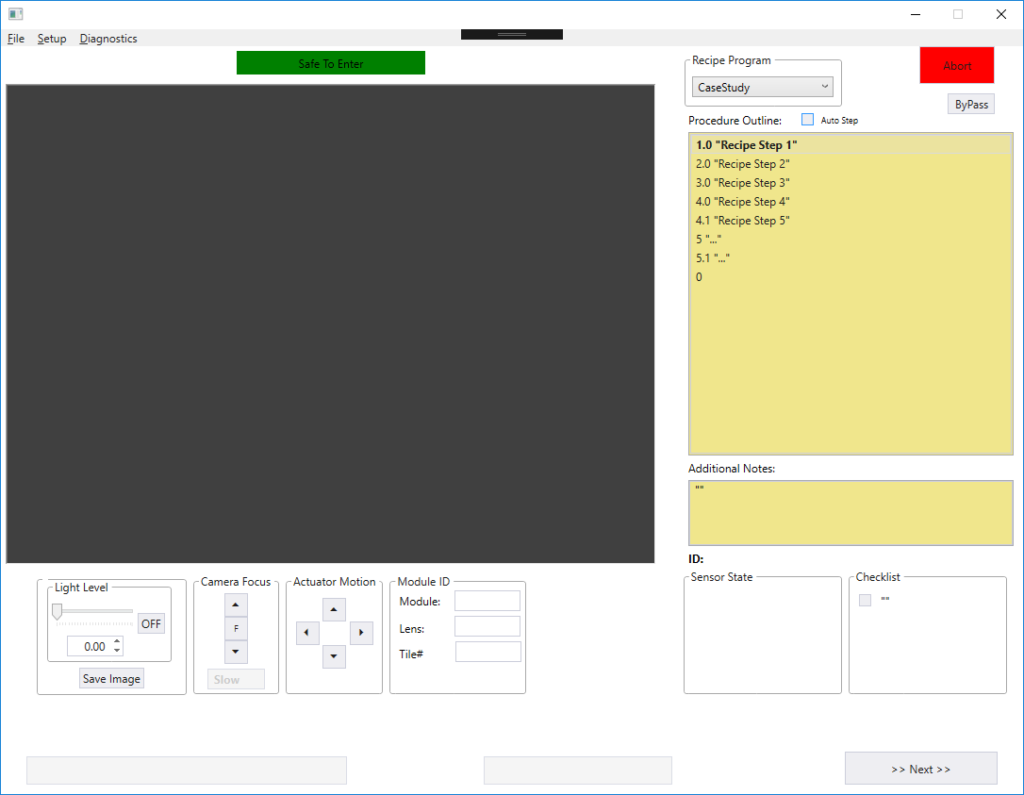
Custom Manufacturing Inspection System
with Machine Vision and Advanced Motion Control
Client – Xerox
![]()
Challenge
Our client had an old manufacturing inspection system (really two systems: one inspection system and an assembly/inspection system) that would no longer be supported by IT and was going to be removed from the network. They needed the operating system updated, so they decided to take this as an opportunity to port the old code from VB to C#.NET, as well as update some hardware.
As migration projects often do, this effort began by working with the client to solidify requirements, followed by a reverse engineering effort to understand the old system to try to make it match the new system as much as possible.
Solution
The updated manufacturing inspection system (one inspection system and an assembly/inspection system) included a new operating system, ported code, new motion control software, new machine vision software, and a new GUI.
Benefits
- OS Update – Updated operating system that is supported by the IT department and is less of a security risk
- Software Porting – Ported software to more maintainable language
- Measurement Accuracy – Increased inspection measurement accuracy for sub-set of measurements
- New GUI – improved operator user experience by improving readability, reducing # of required button clicks, and adding auto scroll functionality
- Report Generation – maintained existing format to interface with customer database
System Overview
The device under inspection is essentially an image sensor array used for scanning images in high end commercial-grade scanning printers. The inspection system utilizes machine vision and precision motion control to verify the location & orientation of several parts, with measurement accuracy measured in microns.
| SOFTWARE FUNCTIONS |
|---|
| Vision / metrology – pattern match and inspection |
| Camera interface |
| Motion controller interface |
| Command Recipe Decoder |
| Report Generation |
| Camera Calibration |
| Robot Controller Command Interface |
| GUI |
| HARDWARE (SELECTED & SUPPLIED BY CLIENT) |
|---|
| Cognex camera |
| ACS motion control system |
| 2-Dimensional Cartesian Robot & Controller |
| Inspection fixture |
| Power Supplies |
| INTERFACES |
|---|
| EtherCAT |
| Modbus/TCP |
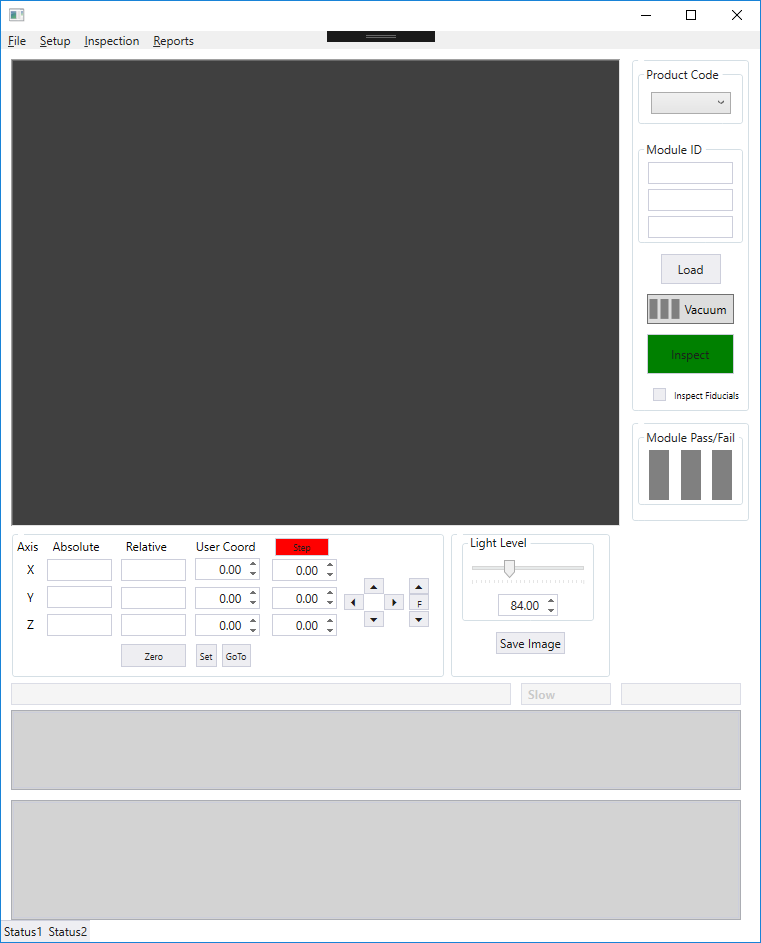
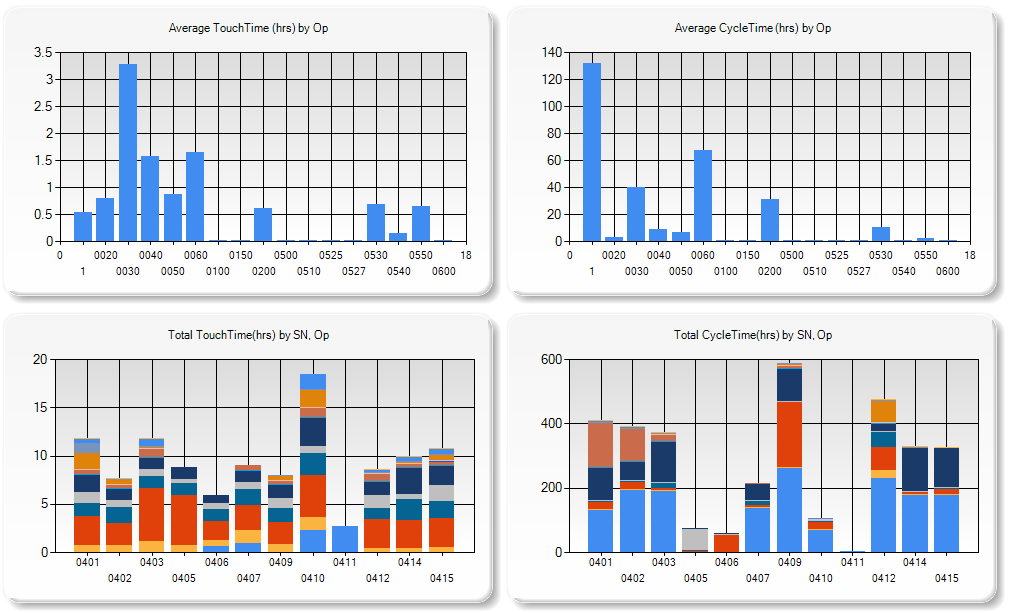
Hidden Factory Assessments Lead to Waste and Cost Reductions

Sharing Business and Test Data Enables Efficiency Improvements
Reduce Production Costs by Coordinating Business and Test Data
Client: A major manufacturer of aerospace components
Problem Scope
Many companies operate in a high-mix, low-volume manufacturing environment. In these situations, production of such parts is often complex, with long assembly and test procedures describing the process to make and verify the part. Discussions of automating any part of these processes are often dismissed because an automated test system is thought to be expensive, especially an aerospace test system which requires significant documentation and acceptance testing efforts. Plus, it’s often erroneously thought that each part needs a unique test system.
Challenge
Our client wanted to improve their capability to manage the assembly procedures and get clarity on the status of any parts, whether partially or fully assembled. The existing situation had data manually-entered into a database form or even handwritten data that needed to be transcribed into a database. Often the database was local to the assembly cell. The chance for error was significant and the lag between data collection and updating the database was often days. When questions arose about the status of a particular unit, many hours could be spent in locating and evaluating the associated forms and paperwork.
The steps needed to achieve these goals were clear: automate the collection data on each part while being assembled so that those results would appear in a business-level database which would give a plant-wide view of the status of all the parts in progress.
Thus, this project needed to allow read/write access to sections of the Manufacturing Enterprise System (MES) database so that information about a part being assembled could be obtained automatically and results could be submitted to that MES database automatically.
Solution
We designed the PXI-based system based on the StepWise test executive platform to automate the assembly and testing. This platform enables two significant changes. These changes were made at each assembly cell by having the operator use a test PC and perhaps some measurement equipment as appropriate for the part(s) being assembled at that cell.
First, we replaced all the printed assembly procedures with electronic records so that any operator could review the latest version of the work instructions on a computer screen. This approach helped with version control, especially important since the client had various model revisions that came through the factor for rework, each with slightly different versions of assembly instructions.
Second, we displayed those electronically documented work procedures as steps in a test executive, allowing the results of each step in the assembly procedure to be captured electronically. When an assembly step was purely manual with no measurements, the fact that step was completed would be recorded, along with information such as the name of the operator performing the step, the duration that the step took, and so on. When a step required a measurement to be made, such as a functionality verification or a calibration result, the measurement would be collected. If the equipment making that measurement could be automated, we would collect that data automatically, and not require the operator to type the result into a computer form.
The outcome of this effort has enabled the client to get a snapshot of the status of parts in assembly, i.e., Works in Progress (WIP), quickly and accurately.
After these changes were made, many additional capabilities are now available with the advent of purpose-built queries into the appropriate MES database tables. The table below shows the overall efficiency gains achieved.
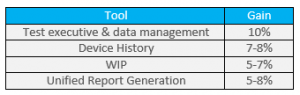
The key is the combination of the electronic test results obtained at the test equipment with information on work orders and manufacturing flow held in the various tables in the business MES database. This improvement happens even with manual or semi-automated test systems, and does not require a completely automated assembly and test system. Thus, the cost of the test system is much less than usually expected and, hence, the benefits are more easily cost-justified.
Designing an Automated Fuel Cell Validation Test Stand
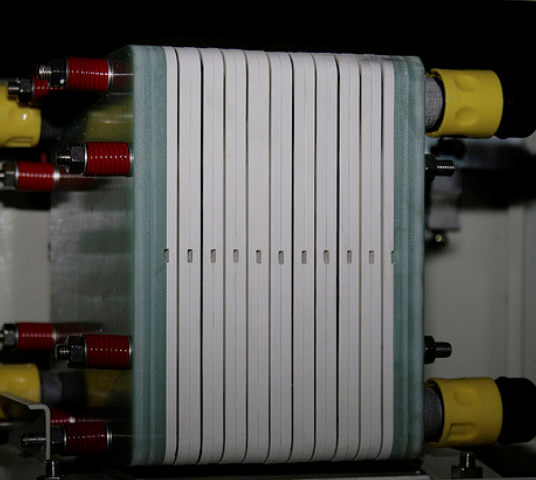
Designing an Automated Fuel Cell Validation Test Stand
Verifying a New Fuel Cell Design Through Automated Operation
Client: A major automotive manufacturer
Problem Scope
Micro Instrument, an automation vendor that builds product validation and test stands, has extensive experience with programmable logic controllers (PLCs) and stand-alone controllers for controlling repetitive motion, safeties, and other “environmental” parameters such as pressure and temperature. The company typically uses PLCs to reliably deliver discrete I/O control and standard PID loop control.
However, Micro Instrument’s customer, a major automotive company, was interested in investigating fuel cells as a power source and they needed to run these fuel cells under a wide range of conditions for extended durations, for both design validation testing and durability testing purposes. These fuel cells required more advanced control algorithms than could be provided with a simple PID. A more powerful controller was needed.
Challenge
The customer knew they needed control loops that predicted system response so we could eliminate overshoot and/or achieve a faster approach to a setpoint. But, because the customer did not know in advance exactly what such “smart” controls would entail, it was beneficial to have the full power of LabVIEW to develop such controls. Providing this functionality with a PLC would be cumbersome, if not impossible.
The customer had some Compact FieldPoint which they wanted to use for this project, so we needed to ensure that this equipment would be sufficient to deliver the required control performance and tolerances. Also, the system needed to conduct PID control in two forms – PWM and continuous control. Importantly, this Fieldpoint hardware had a real-time controller running LabVIEW Real-Time.
Solution
The test system we developed included a 19″ rack test stand populated with fuel piping and control, power supplies, harnessing, data acquisition and control hardware. This hardware was a NI Compact FieldPoint controller, chassis, and modules. The Compact FieldPoint controller was programmed with LabVIEW Real-Time to meet the customer’s system control demands. For example, to predict system response, we programmed the Compact FieldPoint to run control loops that were aware of imminent system-state changes and changed their control schemes accordingly.
As with most validation test systems, we needed to monitor conditions for safety. New product designs are often operated near the edges of safe operation in order for the designer to understand how the product performs in extreme conditions. For this fuel cell application, destructive over-heating and over-pressure could occur. Both digital and analog signals were watched in real-time to assure operation within reasonable bounds and allow a safe shutdown if the fuel cell ran into out-of-bound conditions.
The application used the following independent parallel loops:
- Seven for PWM-based temperatures control
- Two for continuous pressure monitoring
- Four for solenoid and sensor monitoring and control
- 15 safety loops
Data collected during the validation tests were saved to a local PC for later performance analysis and anomaly detection.
The combination of Compact FieldPoint with LabVIEW Real-Time enabled the customer to run the required custom control algorithms and it surpassed the capabilities offered by standard PLCs.
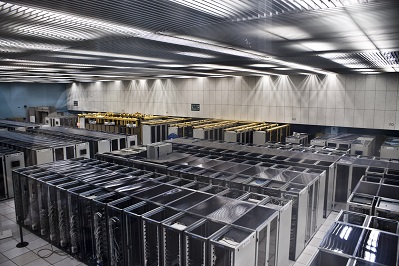
Production Test of Large Uninterruptible Power Supplies
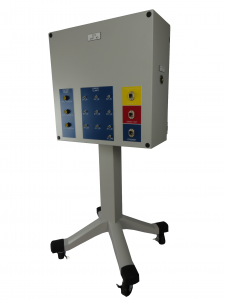
Portable Test Stands for Production Test of Large Uninterruptible Power Supplies
Manufacturing Test of UPS Units Designed for Data Center Backup Power
Client: A major manufacturer of data-critical three-phase uninterruptable power supplies
Challenge
A major manufacturer of very large three-phase uninterruptible power supplies (UPSs) needed better measurement, analysis, and report generation capabilities. Their clients used these UPSs on mission critical equipment, such as data warehouse server farms, communications equipment, and so one. Existing testing procedures used equipment that did not allow for complete simultaneous coverage of all sections of a UPS unit, from input to output. Our client wanted a better understanding of the signals on each of the three phases at various locations within the UPS, especially when power sources were switched or faults were induced. The physical extent of these UPSs could be large, especially when several were combined. Having movable test stands would make access to these test locations less cumbersome.
Also, in the prior test procedure, factory acceptance reports were manually assembled for our client’s end-customers, delaying the final sign-off. Finally, since the end-customer might want to run a specially configured test or run a series of tests in a different sequence than some other end-customer, our client wanted to be able to rerun certain types of tests or run tests in a customer-specific order. Thus, the test sequencing needed to be flexible and editable, possibly on the fly.
Finally, synchronization between the data collection on all signals was critical to assess functionality, since all 3-phases of the UPS output needed to be in the proper timing relationship.
Solution
At a high-level, the majority of testing a UPS relies on knowing the reaction of the UPS to changes on the input side (such as a grid power outage) and changes on the output side (such as an immediate heavy load). Thus, many of the tests performed on a UPS deal with power quality measurements, such as defined by IEEE 519 or IEC 61000 series standards, which cover both continuous and transient operation. The StepWise test execution platform was utilized to allow the customer to develop arbitrary test sequences using the application specific test steps developed for the program.
Our solution used a cRIO to measure both current and voltage from each leg of the 3-phase power (and neutral) by using appropriate cSeries modules connected to various voltage and current test points within the UPS. The cRIO had enough slots to allow a single cRIO to measure a single UPS. This cRIO and connection points were housed in a movable test stand (see image above).
Assessment of continuous operation mainly reviewed the UPS output power quality. Here, it was important to know the amplitude and phase of each leg of the 3-phase power. Synchronous data acquisition between all voltages and current channels was needed for proper timing alignment of collected data points.
Assessment of transient operation was often a review of power ripple and recovery time. For example, in the event of grid power loss, a UPS would switch over to backup power, with the result being a small transient created on the output of the UPS. Again, the voltages and currents needed to be collected synchronously to assure that event timing was aligned.
For increased power capacity, the UPSs could be connected in parallel. When ganged together, the continuous and transient behavior of each UPS needed to be compared to the others, in order to capture the behavior of the entire combined system. Consequently, each cRIO (one per UPS) had to share a clock to enable synchronous data collection across all cRIOs. A timing and synchronization module was placed into each cRIO chassis with one cRIO acting as the master clock source and the others being slaved to that clock. Several test stands were then connected together to share this clock to achieve the simultaneous sampling across all test stands.
The overall test system architecture has a master PC communicating with each cRIO. Each cRIO was placed in certain activity states by the master PC, such as “arm for measurement”, “transfer collected data”, and “respond with system health”. This arrangement enables the number of cRIO-based test stands to shrink or grow depending on the number of UPSs being testing in parallel.
Results
The test system connected the timing module in each cRIO-based test stand in a daisy-chained configuration, leading to data sampling synchronization error of less than 100 ns between all cRIOs, which translates to about +/-0.001 degree phase error for 60 Hz power signals. This timing synchronization was more than sufficient to analyze the collected waveform data for power quality and transient structure.
LabVIEW was used to create various configurable test steps that could be executed in random order as well as in an automated sequential manner. Our client was thus able to test a UPS in a predefined manner as well as react rapidly to queries from their customer when they were viewing a factory run-off test. For example, the customer might ask to re-run the same test several times in a row to validate consistent responses.
Each type of test included automated analysis routines that numerically calculated the relevant parameters against which the UPS was being checked. Not only was this automated calculation faster, but it reduced mistakes and improved reproducibility as compared to the previous post-testing partially manual calculations.
Data from all tests, even repeated ones, on a given UPS were archived for quality control purposes and made a part of the device history for that UPS.
Finally, the report generation capability built into this test system was far superior to the previous methodology by allowing our client to hand their customer a professional report package practically immediately the testing was complete. Customer satisfaction was improved substantially with this state-of-the-art test system.
Manufacturing Test – for mission-critical components

Manufacturing Test – for mission-critical components
Using PXI & LabVIEW RT
Client: A major manufacturer of implantable cardiac and neural stimulators
Challenge
Our client needed several extremely reliable test systems to test the batteries that power their implantable medical devices. These new test systems were needed for two main reasons. First, the needed to upgrade existing obsolete test equipment, based on antiquated hardware and software. Second, new battery designs could not be tested on the old equipment.
A critical aspect of the new test system was the need to detect any excessive charge being extracted from the battery, thus rendering it unsuitable for surgical implantation. Thus, the test system needed to monitor the total energy withdrawn from a battery during testing to assure that it never exceeded a certain limit while also offering precise control of the type of pulses being drained from a battery.
All test results had to be stored in a database in order to maintain device history for each battery manufactured for archiving, quality control, and process improvements.
Solution
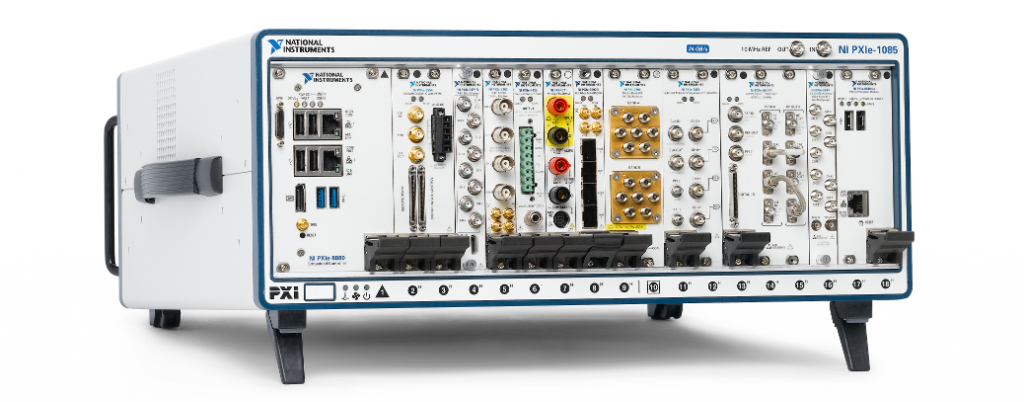
The updated manufacturing test system is PXI-based along with a custom micro-controller-based circuit board for some low-level control. Each PXI controller communicated to the microcontroller (uC) on the custom PCB via CAN. The uC controlled the current drain from the battery while monitoring actual current and voltage from the battery at over 1000 samples per second using a precision 6.5 digit PXI DMM. Additionally, each PXI chassis was used to test many hundreds of batteries. Signal connections were handled by several switch multiplexers. Overall control of all the PXI testers was managed by a host PC connected to the PXI controller.
Benefits
- Reduced test system cost vs complete COTS solution with combo LabVIEW RT on PXI and firmware on microcontroller-based custom circuit board
- Enabled tight control of DUT operation on controller with microsecond level responsiveness while being supervised by higher-level PXI RT
- Quick-reaction test abort capability
- Test results stored to database for archiving, quality control, and process improvements
System Overview
In a simplified view, the testing proceeded by pulsing the battery with a series of different durations and varying amperages. The exact sequence of this pulsing is unique for each DUT model. Measurements were made using a PXI filled with various NI boards such as DMMs, for accuracy, and data acquisition cards, for general purpose use.
Additionally, the pulsing amperage levels needed to be tightly controlled in order to know that the tests have been performed properly. Thus, a real-time amperage control scheme had to be implemented to maintain the level requested for the pulse. We chose to accomplish this control via an analog control circuit developed using a custom Viewpoint-developed circuit board. This board was controlled via a Microchip PIC microprocessor. The LabVIEW RT application communicated with the microcontroller to setup the pulsing sequence and coordinate the start and stop of the pulsing and the NI acquisition hardware.
This custom circuitry also reduced the overall cost of the test system by about 40%.
The engineering time to design this custom circuitry was more than offset by the reduction in material costs because more than 10 test systems were deployed, allowing the non-recurring engineering effort to be shared between many systems.
When no critical issues were detected, the waveforms acquired by the PXI system were stored and then analyzed to determine the viability of the DUT. The pass/fail disposition, the waveforms, the total energy consumed, and other test results were then passed along to a host supervisory PC that managed all these results in a database for archiving, quality control, and process improvements, each set of results being tied to the unique unit serial number.
The test systems provided reliable operation for testing the large annual production volumes of the mission-critical DUTs.
Since we designed the system to interface to our customer’s host supervisory PC via ethernet-based commands, the verification and validation (V&V) process could be supported by our customer in their Installation and Operational Qualification (IQ/OQ) efforts. Specifically, they wrote the IQ/OQ procedures around software that emulated interfacing with the host supervisory PC. This approach allowed them to automate parts of the V&V thus saving them almost 1 week of effort.
| SOFTWARE FUNCTIONS |
|---|
| LabVIEW RT – for managing the microcontroller functions and overall data collection and safety monitoring |
| Microcontroller application – to provide precision pulsing of the batteries |
| Communicate to the host PC – to both receive pulsing instructions and configurations and to return pulse waveforms for each battery tested. |
| MAIN HARDWARE COMPONENTS |
|---|
| PXI chassis & controller |
| PXI DMM |
| PXI analog input modules |
| SCXI multiplexing switches |
| INTERFACES / PROTOCOLS: |
|---|
| Ethernet TCP-IP |
| CAN |
Monitoring of Testing Inside Environmental Chambers

Monitoring of Testing Inside Environmental Chambers
Our customer required a system that would replace manual charting of tests performed inside various environmental chambers.
Viewpoint designed an automated solution which notifies the technician when the test chamber requires attention and reports chamber utilization for planning and scheduling purposes.
Application
This application was designed for a group that provides long-term thermal and environmental testing to a large number of internal customers at its facility. The group is responsible for approximately 80 environmental chambers which are used for a variety of tests for electronic circuit boards and modules.
These tests typically last between 100 and 4000 hours, with the environmental chambers cycling temperatures according to an externally programmed profile. This system was developed to automatically monitor and provide oversight to the various test chambers under the department’s control.
On an individual chamber basis, the system can verify that the chamber is performing to the test expectations, provide an audit mechanism and generate alarms when the chamber is not operating correctly. The software also is flexible enough to add and edit individual chambers and the tests inside them. The data collected is compared to set limits and, where appropriate, alarms are generated and events are logged to keep a history of what occurred during a test. The test system is capable of running many tests simultaneously.
The system is scalable and more thermal chambers can be added as needed. The operator can view the status of any given test by selecting the test to be viewed and observing the trend. The server software running on the server PC is tolerant of user logins and logoffs as it is running as an Windows service.
Technical Highlights
The software was written in LabVIEW as a client/server style application. Using LabVIEW and a small stub of “C” code, the server portion of the software was built into a Windows Service. There is no interface to the server other than the client. The client uses the LabVIEW VI Server technology to communicate with the server. This configuration allows the technicians to check the status of any test from their desk or a remote location.
Test configuration allows the operator to be notified when alarm conditions occur or for a regularly scheduled check of the chamber. The system notifies the operator by sending an email and/or by sending a message to their pager.
All test status information is persistent in an MS Access database so if a power failure occurs, or the system goes down, the tests in progress are not lost. When the system is powered up again, the system will restart any tests that were in progress. Two days of history data is kept in memory for each test so trends can be identified.
The system can generate a number of reports, such as job status, journal events, chamber status, completed test results, and chamber utilization. For each type of report, the technicians can pick from a list of criteria to filter the requested information.
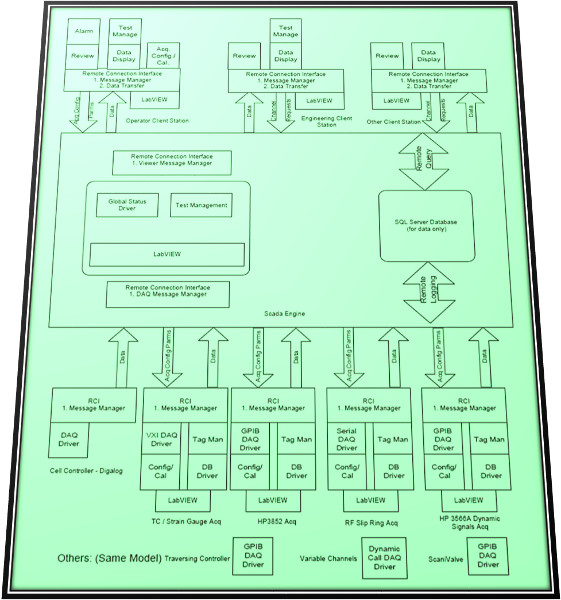
Gas Turbine Test System

GAS TURBINE TEST SYSTEM
A MEDIUM SCALE SCADA SYSTEM
Client: Dresser-Rand
Problem Scope
For this application, Dresser-Rand needed an extensible system capable of monitoring numerous signals interfaced to a large gas turbine. Well over a
thousand signals needed to be collected from an extremely varied set of data acquisition devices and instruments. The configuration of this system and
viewing of data needed to be available from any of a number of computers connected to the data acquisition network. Also, data needed to be available for additional processing on other connected networks. Dresser-Rand required that all of the components that were necessary to run a test, such as the server, database, acquisition, configuration, and viewing, were able to be run on one computer or distributed over several computers.
Solution
This system utilizes Client-Server architecture to acquire signals from a variety of devices and logs the data to a central SQL Server database. The data is then processed and viewed on remote terminals. It is modularly designed to facilitate changes in acquisition hardware as well as viewing and processing software. There are three important components to this application: a SQL Server data management system, TCP/IP packet based messages for configuration and data, and a flexible, applicationindependent driver model.
National Instrument’s LabVIEW was used for the bulk of this project. C, Visual Basic, and Fortran were also used to develop analysis routines and interface with various pieces of hardware.
Technical Highlights
- Client-Server technology
- TCP/IP packet based messages for communication of data and commands
- 100base-T local network with bridge to other company/worldwide networks
- Remote configuration and viewing
- SQL Server database
- High channel count (1000+ signals)
- Flexible data acquisition system
- Diverse data acquisition devices: DAQ, GPIB, VXI, RS-232, PLC
- Common driver model – drop in drivers, self-aware configuration
- Common calculation model – drop in calculations, self-aware configuration
- Flexible GUIs with drop in screens
Several software technologies used for various aspects of the project: LabVIEW, Microsoft SQL Server, Microsoft PowerStation Fortran, Microsoft Visual Basic, Microsoft C, Microsoft Access
System Overview
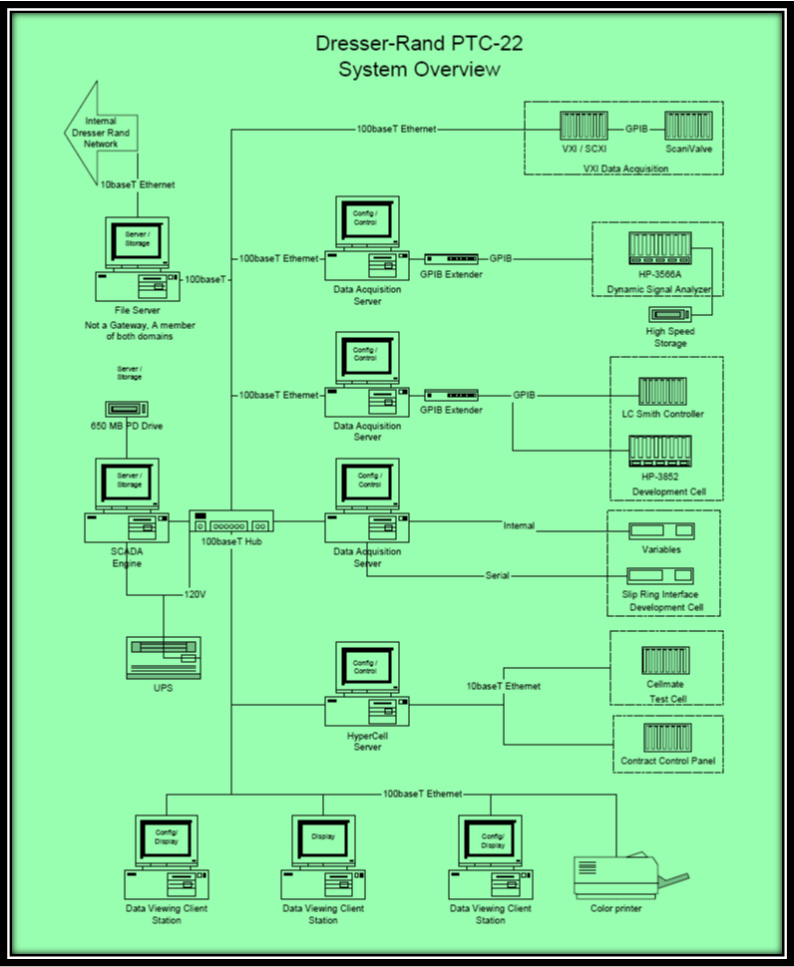
Software Architecture
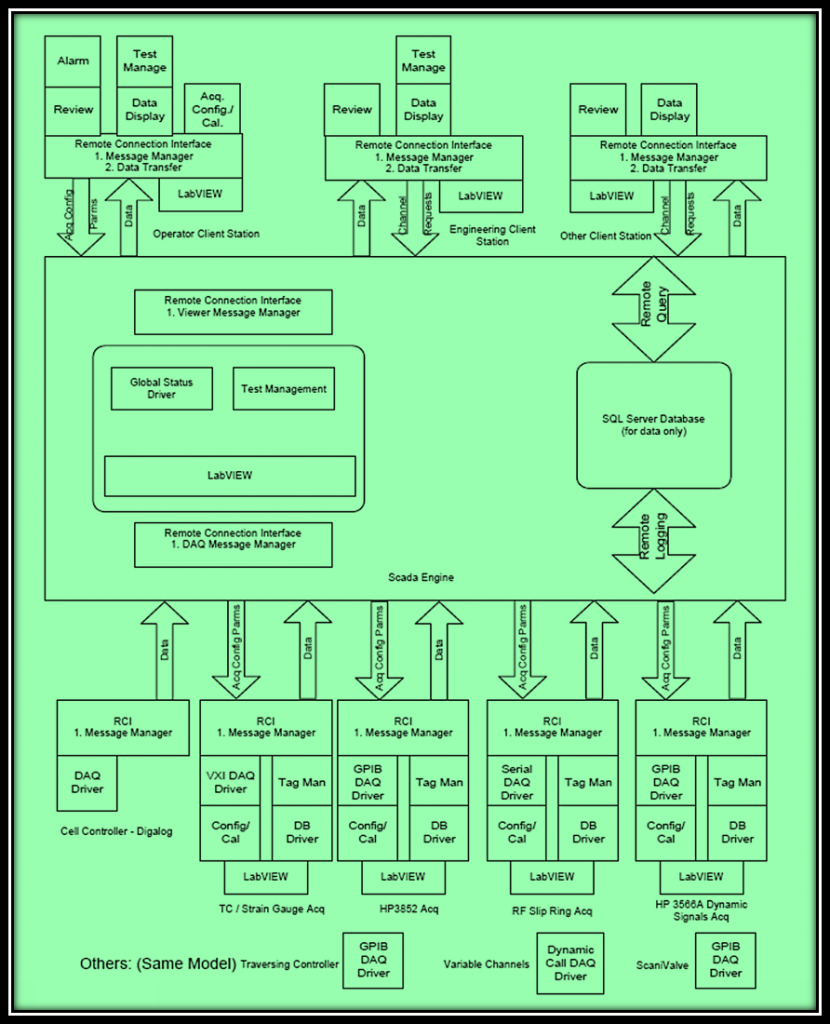
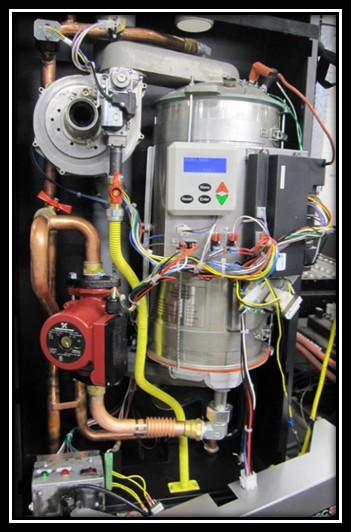
Automated End-Of-Line Tester Upgrade – Boiler

Automated End-Of-Line Tester Upgrade – Boiler
Automated End-Of-Line Tester upgrade makes operators and engineers happy
Client – ECR International: A manufacturer of heating and cooling systems.
Challenge
ECR has significant domain expertise in developing boiler systems. Viewpoint has significant domain expertise in measurement and control systems. To ensure quality control ECR International utilizes an end-of-line testing stand. Each boiler is test fired and adjustments are made to optimize proper combustion. Results of the testing are recorded along with the boiler’s unique serial number.
The team at ECR needed an upgrade to one of their end-of-line test systems to support an increase in production capacity without sacrificing the testing and quality assurances process.
ECR also wanted to eliminate the need to constantly adjust test limits based on temperature. This manual adjustment process was time consuming.
They took this as an opportunity to update and clean up the code base for supportability.
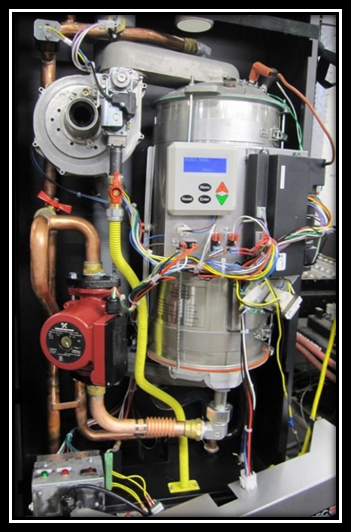
Solution
Viewpoint was asked to upgrade the existing test stand code and add a bit of functionality. Since ECR already had the necessary hardware, Viewpoint worked with the existing hardware set, porting software and adding new features.
The updates improved usability, saved time, and increased accuracy.
The solution was delivered on time and under budget.
Benefits
- Test time reduction and increased accuracy (automated temperature-based test parameter control)
- Increased test flexibility (can test at multiple boiler capacities)
- Improved operability with updated user interface
- Improved development supportability with cleaned up code base
- Improved IT supportability with updated code base
- Increased stability (EEPROM test stand lock-up resolved)
System Overview
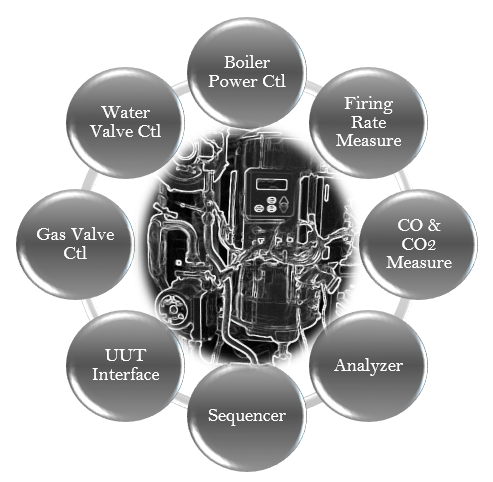
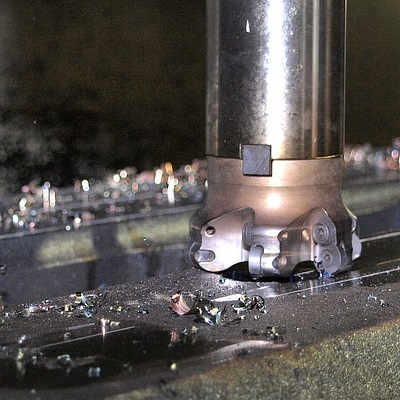
Improving Efficiency in Industrial Manufacturing Test

Improving Efficiency in Industrial Manufacturing
Simplifying Report Generation for High-Mix, Low-Volume Industrial Servo Valve Tests
Client: A major industrial servo valve manufacturer
Challenge
A manufacturer of components for both commercial and military aircraft built a large number of different models of servo valves. Some models were made only a few times each year, while other models were made with an order of magnitude higher volume. Each unit underwent rigorous testing during and after assembly.
Our client needed to submit the results of that testing to their customers but since the production and testing of each unit happened in many locations, possibly even around the world, many hours were spent locating the appropriate datasets and assembling the report.
Furthermore, our client wanted to improve their responsiveness to requests from their customers by having rapid retrieval of the test report for any part after it had been delivered into the field.
Solution
Since the test datasets were varied due to the large numbers of different valve models and associated test procedures, a database was created using a platform based on the Resource Description Framework (RDF). An RDF database can accept arbitrary types of data, manage that data through metadata tags, and adjust gracefully to changes in content and shape of the connections between objects in the database.
This adaptability was key to our client being able to leap past some of the issues in standard SQL-based relational databases.
The results from each test run on each part at each (PXI-based) test system were tagged with metadata and pushed into the RDF database. The StepWise test executive platform interfaced to the RDF database by outputting XML content which was scanned by a routine created for the RDF database and converted into the RDF data and links. The part ID was a critical tag since this allowed searching the RDF database for all results associated with that specific part. This database resided on a server at the client’s headquarters and accepted data from worldwide locations.
Once the data for each part was housed in the database, a report could be generated. To accommodate the variety of data in that report, web technology was used to render the report pages based on the types of data entered into the database, as described by the metadata tags. For example, data identified as waveforms could be plotted or listed in tabular format. Having reports rendered based on the data types made it possible to handle adjustments to the types of data measured by the test system.
Results
With the ability to render reports quickly, our client could produce detailed reports for their customers indicating the performance of any specific requested servo valve.
Our client was able to trim the time to create reports to less than 1 day from the previous effort of 3-5 days and with less error.
- Data are now organized uniformly, simplifying the location of desired information, as compared with files stored on various test PCs and file servers.
- The client has the ability to generate automatic emails to their customers with the required reports already attached and ready to go.
- In potential warranty and customer service situations, having the ability to send the customer a report within hours represented great customer service.
All these features are available consistently across worldwide manufacturing facilities, reducing training and maintenance of procedures. And, of course, the reports handle using metric or English units as appropriate for the end customer.
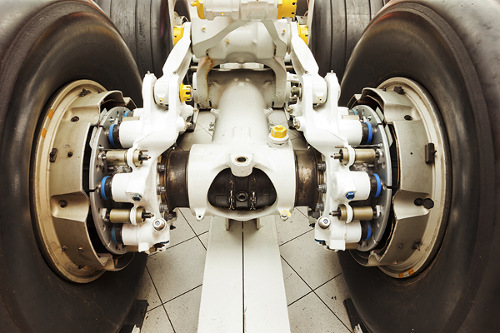
Decreasing Test Time for Aircraft Landing Gear

Decreasing Test Time for Aircraft Landing Gear
Endurance Testing for Aircraft Nose Landing Gear Steering
Client: A major manufacturer of aircraft landing systems
Challenge
A major manufacturer of aircraft landing equipment needed to develop a means of endurance and fatigue testing new designs for aircraft steering. The actuators involved in steering the nose landing gear (NLG) required precise and reliable control through thousands of steering cycles.
Control loops needed to be closed at faster than 1 ms.
Prior systems were handled manually without real-time control and monitoring.
Solution
Our customer designed and built a test rig to provide the hydraulics and environmental conditions for the endurance testing on the NLG. Viewpoint Systems supplied the electronic data acquisition and control hardware coupled with real-time software to provide the required fast control loops. The configuration and execution of the 1000s of steering cycles were managed by the same data acquisition and control system through a set of configuration screens that allowed specification of turn rates, min/max angles, drive and resistive torque settings, and so on. The flexibility offered with this HIL test capability mimicked the variety of conditions that the NLG would encounter in actual use.
- The various PID control loop configurations were also configurable along with gain scheduling required under different operating conditions.
- The environmental conditions were supported by controlling a temperature chamber through ramp and soak settings occurring during the steering tests.
- Measurements on the steering performance were collected from commanded setpoints, sensor readings, and controller outputs during the entire test run.
- Alarm and fault conditions, such as force exceedance, were monitored continuously during operation so that the system could safely run unattended.
Since the deployed solution was an aerospace test system, the entire system underwent an extremely rigorous acceptance testing procedure to verify proper and safe operation.
| SOFTWARE FUNCTIONS |
|---|
| Arbitrary Load and Position Profiles |
| Flight Position Control |
| Load Position/Force Control |
| Endurance/Flight Schedule Execution |
| Deterministic RT for DAQ and PID Control |
| HARDWARE |
|---|
| PXI/SCXI Hybrid RT Chassis |
| Discrete Pump Skid Interface |
| Custom Control Panel/Console |
| INTERFACES |
|---|
| Ethernet TCP/IP |
| SCXI |
Results
Prior to deployment of our system, setup of a test was much more manual and operators needed to be around to monitor operation.
With our new system, complete endurance testing could be specified and executed with minimal supervision. Furthermore, the tight integration of real-time control, HIL testing, and coordinated data collection made report creation much simpler than before.
The rigorous acceptance test gave trustworthiness to the data and allowed the design engineers to validate performance more quickly than the prior semi-automatic and manual methods of operation.
Setup of tests has been improved from prior operations. The endurance testing itself operated over a huge number of cycles lasting weeks to months between scheduled lubrication and maintenance.
The deployed system measures performance during the entire testing, even between the scheduled downtime.
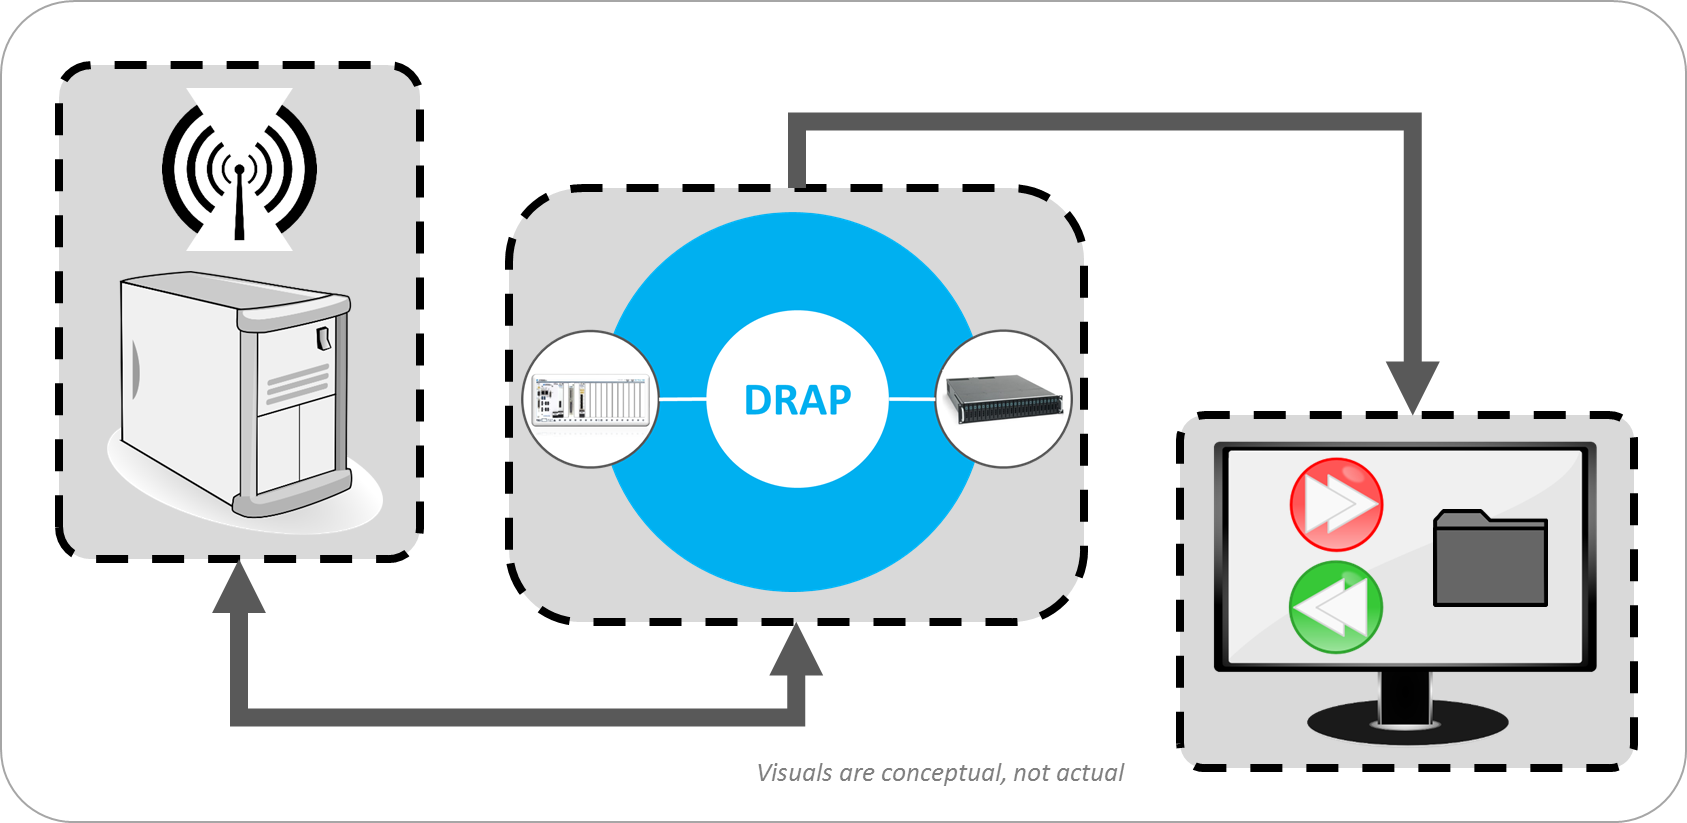
Digital Record And Playback – For a RF Receiver

Digital Record And Playback – For a RF Receiver
Collect hours of data at >1 GB/s
Client: A large high-tech R&D-oriented company.
Challenge
- Record hours of data at >1GB/s
- Play back digital test patterns for the RF receiver at real-time rates to understand bit-error rates
- Understand effects of RF chain prior to digitization
- Allow for platform to assist with algorithm development, debug and optimization
Solution
We utilized off-the-shelf hardware combined with custom software and had a working system after ~7 man-weeks of effort. The AEDIS system records and plays back digital data only, with A/D conversion being handled by the DUT. The system was developed on the National Instruments PXI Express platform. A RAID array of disks is used to continuously record data. Data manipulation is performed on a Xilinx Kintex-7 FPGA that forms the basis of a National Instruments High Speed Serial board. The AEDIS system is connected to the RF receiver using standard SFP+ connectors. A UI connects to the system locally or over Ethernet to monitor and control AEDIS during record/playback. The customer can also control the system via an API so that it can be integrated into a larger test system.
Benefits
- Allows for repeatable data through the processing chain.
- Can re-sample data, inject new headers into data packets, and re-pack new data.
System Overview
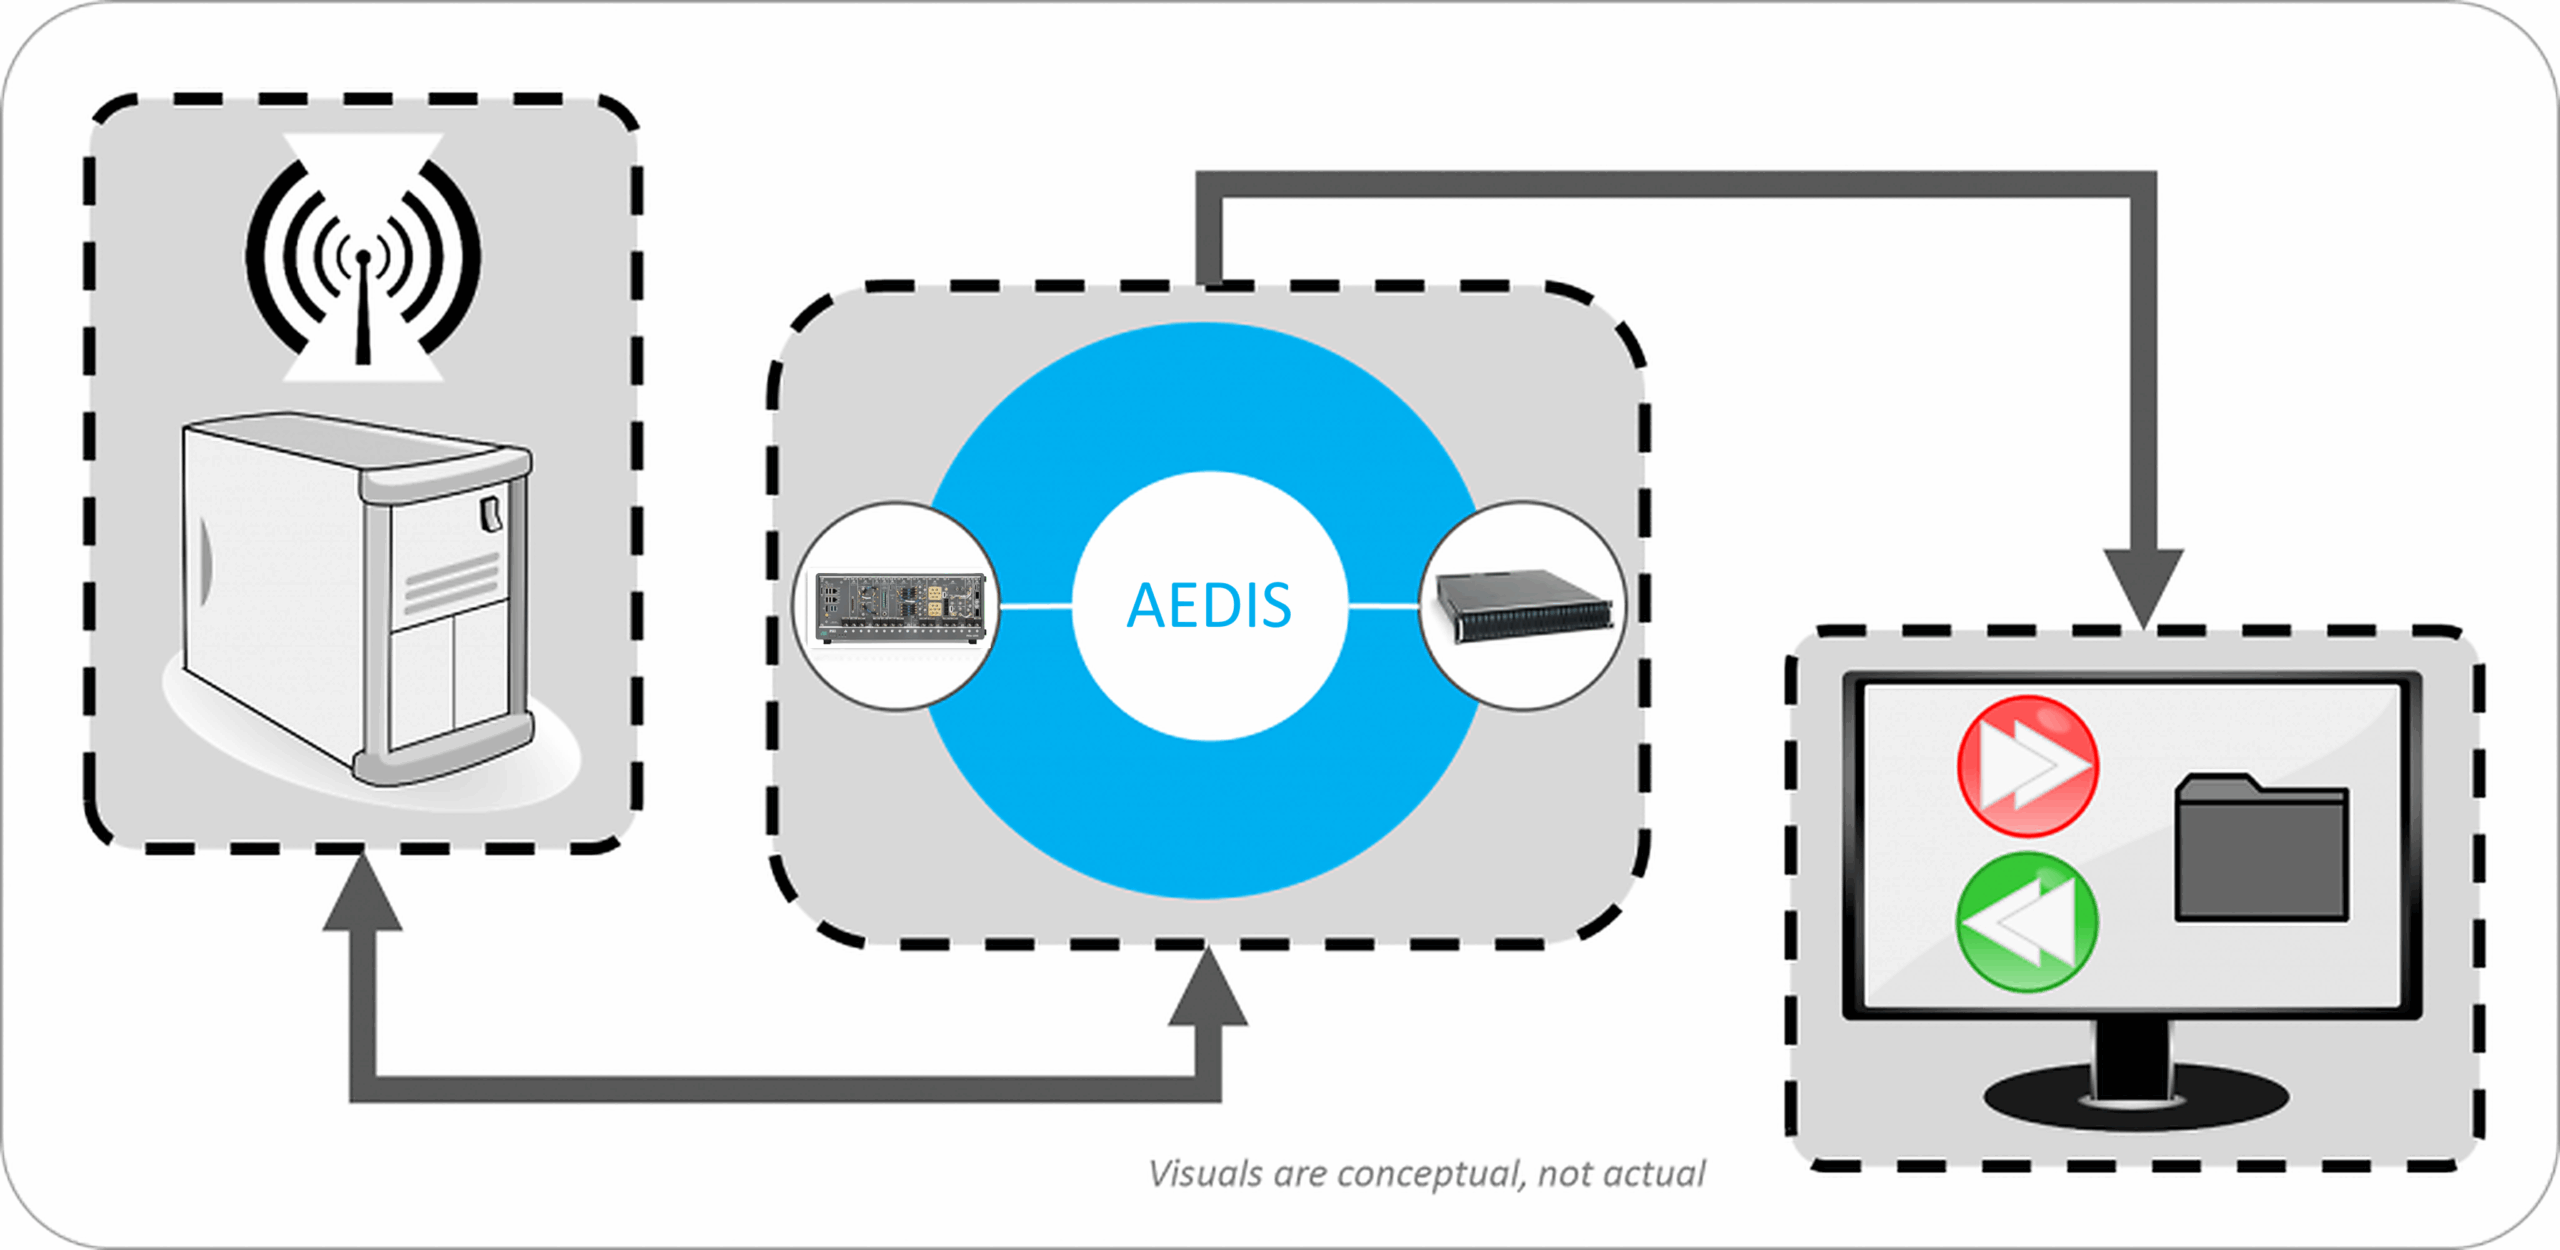
Manufacturing Test System for Electrical Components

Manufacturing Test System for Electrical Components
Replacing Obsolete Custom Electronics with cRIOs in High-Power Capacitor Testing
Modular Embedded cRIO-based Test Stands Shorten Development and Reduce Risk in Complex PC-based Test System
Client: A major manufacturer of electrical power generation and distribution equipment.
Problem Scope
This project involved retrofitting a test system used to verify operation of a high-power capacitor used in electrical power distribution. This system was originally built around 1990. Critical sections of the original test system relied on custom, wire-wrapped analog and digital circuitry to process, analyze, and isolate the high-voltage and high-current signals created by the capacitor. Analog filters, rectifiers, and comparators produced pass/fail status signals. A master PC, other measurement and control equipment, the analog circuits, and a six-position carousel were integrated to create the entire automated test and control system.
For each unit under test (UUT), test specifications are obtained from a Manufacturing Execution System (MES) and cached locally. The test stands at each carousel position are designed to run independently. This parallel capability allows greater throughput and reduced test time per capacitor unit. In addition, as different capacitor models move through the carousel stations, the test stand at each station must be aware of the particular model being tested at that station and adjust test parameters and conditions accordingly.
Test results for UUT are pushed back to the MES system for record retention and data mining. The existing MES interfaces were retained exactly for the retrofit.
Challenge
All capacitors require 100% testing prior to shipment, so the test system is critical for the facility operation. Two or even three shifts are common depending on production needs and the facility cannot afford any significant downtime. Thus, a challenge was to design and build a test system that worked and was very robust.
Another huge challenge was the lack of documentation on the existing system, requiring a sizable amount of reverse engineering to understand the test system operation before development on the new system could begin.
Furthermore, one of the most important challenges surrounded replacement of substantial amounts of original test equipment before the new test equipment could be installed. Thus, we absolutely had to minimize the time and risk in this upgrade changeover.
Technical Highlights
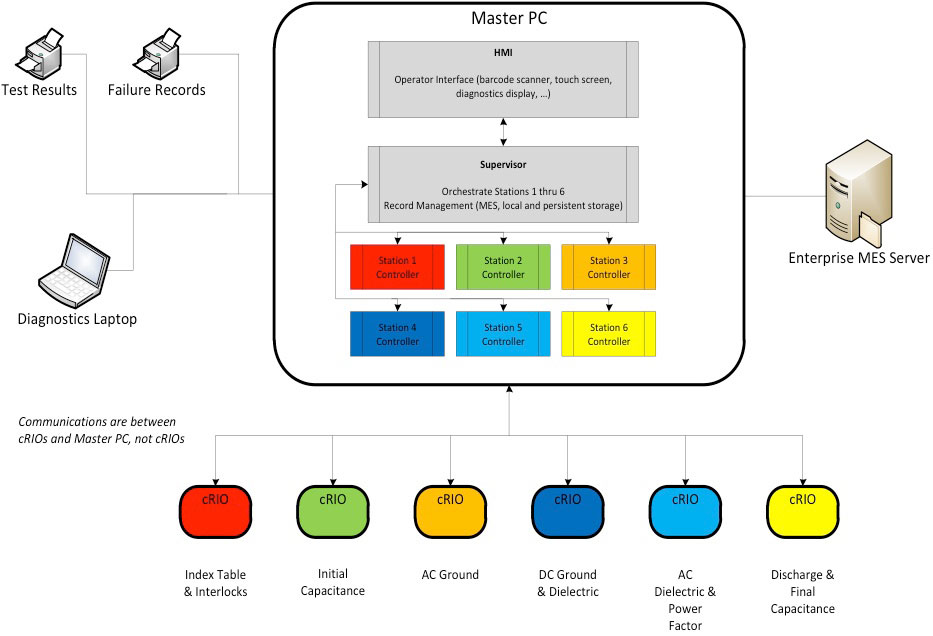
A schematic of the overall system architecture is shown in the figure. The major components of the system are:
- Master PC for supervisory control and test execution management
- NI cRIOs with FPGAs and Ethernet for test stands providing independent yet PC-supervised operation
- Station-specific FPGA code for replacing wire-wrap circuitry functionality
- Integration with existing MES, safety equipment, tooling, and measurement hardware
The architecture chosen was made very modular by the capabilities offered by the cRIO. The Master PC interfaced with station-specific measurement instrumentation as needed, such as GPIB controlled equipment, and coordinated control and outcomes from the cRIO-based test stands. This additional equipment is not shown in the figure.
Solution
The Master PC had three main functions
- Coordinating all the activities across the six cRIO-based test stands.
- Interfacing with the existing MES database and printers at the manufacturing facility.
- Providing the operator interface and, when needed, access to engineering screen on a diagnostic laptop.
The cRIO-based test stands were essential to the success of this test system. Each cRIO functioned as the equivalent of a high-speed standalone instrument.
The cRIOs at each carousel test position provided the following features:
- Digital I/O for machine feedback, safeties, and fault conditions
- State machines to coordinate with external commands and signals
- Perform numeric calculations to emulate the old analog circuitry
- Control loops for currents associated with voltages needed by different capacitors
- Communication support with the master PC
- Computation and detection of internal fault and UUT pass/fail conditions
We were able to duplicate the behavior of the wire-wrapped circuitry by converting the schematic diagrams of these circuits into FPGA code and then tweaking that code to mimicking the actual signals we measured with data acquisition equipment on the original test hardware.
The outputs of the circuitry were reconstructed on the FPGA with band-pass filtering, calibration compensation, point-to-point RMS, and phase & frequency functions. This functionality was implemented in fixed-point math and the 24-bit inputs on the A/D provided sufficient resolution and bandwidth for a faithful reproduction of the electronic circuitry. These embedded cRIOs provided a very effective solution to what otherwise might have required another set of costly and rigid custom circuits.
Finally, for optimizing the task of replacing the old equipment, we used a set of cRIOs, not shown in Figure 1, to provide Hardware-In-the-Loop (HIL) simulation of the manufacturing and measurement equipment. These cRIOs imitated the rest of the machine by providing inputs to and reacting to outputs from the embedded cRIO controllers, thus supporting comprehensive verification of the new test system before the tear-out of the existing hardware. Furthermore, these HIL cRIOs enabled fault injection for conditions that would have been difficult and possibly dangerous to create on the actual equipment.
We’ve helped teams at some of the world’s most innovative companies