Custom Pump Test Stands

Check out our article in Pumps And Systems: 5 Considerations When Designing a New Pump Test System.
Some tests we’ve implemented
How we can help: capabilities & expertise
Pump Test Case Studies

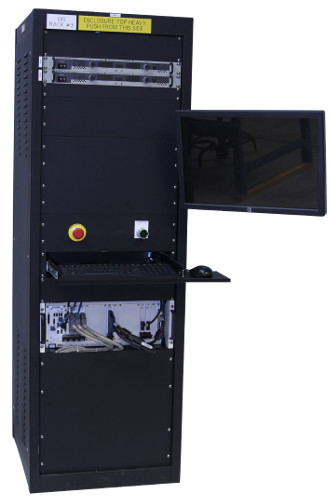
Pump Test Station – Increasing throughput
Pump Test Station – Increasing throughput
Standardizing on testing technique & reporting
Increasing test throughput with automation
Client – Industrial pump manufacturer
Challenge
Pump manufacturers typically test their product in the same facility in which the pumps are created. These tests are well defined and based on standards created by organizations such as API and ANSI to name a few. These tests are run to verify the performance of the pump as well as provide a report to the customer demonstrating that the pump they purchased will meet their needs. Sometimes these tests become factory witness tests where the customer sits in on the testing being performed on the pumps they had purchased.
This particular pump manufacturer had a test facility where many different sizes and types of pumps could be tested. The software provided to them by another integrator to run the test stand had the desired user interface screens, but did not function as requested, and was missing certain desired features.
Our client came to us with the following requests:
- Evaluate the software written by the previous integrator to assess whether any of the code could be reused in the new application.
- Ensure that existing cDAQ hardware would be compatible with changes and improvements to the software.
- Deploy the hardware/software solution on the test site to verify it performed as required.
Solution
The Pump Test Utility was used for end-of-line test and product validation.
It had the following features:
- A Pump Test application that can run one of the following tests at a time:
- Performance Test.
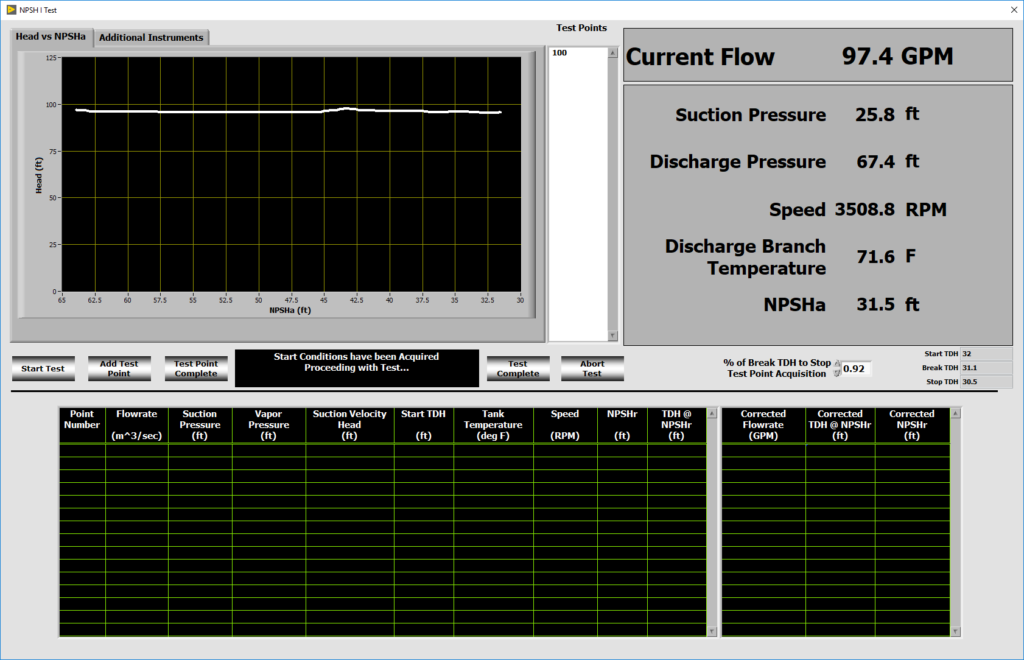
- Net Positive Suction Head (NPSH) Test.
- Mechanical Test.
- All test configuration and data files generated by the software must be compatible with Microsoft Excel.
- Ability to show vibration data real time while the test is running.
Benefits
- Standardization of testing technique –each pump will be tested with the same procedures and calculations/algorithms.
- Automated generation of report content and presentation – automation of this step will save hours of manually recording data and entering that data into a spreadsheet to generate the same report.
- Automation of the reporting and elimination of the need to manually record data will increase throughput of the testing facility.
System Overview
We developed the Pump Test Utility application to allow our client’s engineers and operators to:
- Run one of three guided tests that visually provides pump performance feedback during the test.
- Create a test configuration user interface that will be used to store configuration information that can be recalled when testing a similar pump.
- Automate the collection of data during the test.
- Automate the population of report templates with the configuration and data acquired during the test.
- View and print out vibration graphs real time during the test.
The pump test software was developed in LabVIEW.
It interfaced with simple delimited text files and Excel workbook templates to save the configuration information necessary to set up and run the required tests.
The resulting data acquired during the test, both raw data acquired from the sensors and calculated data used to characterize the pump being tested, are saved to delimited text files.
Both high-speed (10 kS/s) and low-speed (10 S/s) data are acquired. High-speed data are graphed real time in a separate UI that allows the user to set cursors on the graph for visualization and printing to a pdf report.
Low-speed data is written to a delimited text file for archival storage and retrieval if additional analysis is required.
The high-speed data are for vibration measurements. The low-speed data are for pressure, temperature, RPM and flowrate measurements.
Flow rate and vacuum pressure were automatically adjusted using a PID loop and 4-20 mA controlled valves.
The pump test configuration is performed within the application from a series of drop-down selections populated with sensors found in an Excel workbook. The Excel workbook is updated and maintained outside the application. Once the test sensors and conditions have been selected, those selections are written to an Excel workbook for use in the reports.
The Excel ActiveX interface was used to develop the reports the client provided to their customers for the slow data. The Excel workbook template contained the formatting necessary for the reports. As the software wrote the data into the workbook, the reports were built from the formulas and formatting already configured in the Excel template.
At the end of the test, the software printed the appropriate worksheets containing the elements of the report required. The vibration (high-speed data) is written to a binary file and a pdf.
| SOFTWARE FUNCTIONS |
|---|
| Data Acquisition |
| Test Sequencing |
| 3 Standardized Test Types |
| Generate Standard Table-Based Reports |
| Generate Pump Performance Graphs |
| Generate Vibration Graphs |
| Sensor Management Tools |
| Test Configuration Management Tools |
| HARDWARE USED |
|---|
| NI cDAQ Signal Conditioning Chassis |
| Variety of NI cSeries Signal Conditioning Modules |
| Pressure Sensors |
| Level Sensors |
| Flowmeters |
| Vibration Sensors |
| Displacement Sensors |
| Temperature Sensors |
| Torque Sensors |
| Speed Sensors |
Pump Test Station
Pump Test Station
Client – Industrial pump manufacturer
Standardizing on testing technique & reporting
Reducing the number of pumps in the production queue
Challenge
Pump manufacturers typically test their product in the same facility in which the pumps are created. These tests are well defined and based on standards created by organizations such as API and ANSI to name a few. These tests are run to verify the performance of the pump as well as provide a report to the customer demonstrating that the pump they purchased will meet their needs. Sometimes these tests become factory witness tests where the customer sits in on the testing being performed on the pumps they had purchased.
Most pump manufacturers have more than one testing site at a facility to accommodate different pump types and sizes. The ability to automate these tests and to present a common look to the testing process and reports make the customer experience more positive to those reading the reports and/or witness the testing.
Our client came to us with the following requests:
- Evaluate the software written by the previous integrator to assess whether any of the code could be reused in the new application.
- Specify a hardware and software solution to acquire the signals needed to compute the performance results for standard tests. We made recommendations and selected appropriate hardware based on comments from our client about desiring compatibility between their test stands around the world.
- Deploy the hardware/software solution on the first test site to verify it performs as required and then deploy to the remaining test sites at their facility.
Solution
The Pump Test Utility had the following features:
- A Pump Test application that can run one of two different tests; a performance test and a net positive suction head (NPSH) test.
- An Access database was used to store the available sensors for that test site. The user selected the appropriate sensors while configuring the test.
- The test data was stored in an Excel file where each pump received its own Excel file.
- The LabVIEW Report Generation toolkit was used to populate the Excel file with data as well as create the report for the pump
Benefits
- Standardization of testing technique – now each pump will be tested with the same procedures and calculations/algorithms used are standardized across all test sites within the facility.
- Standardization of report content and presentation – now every customer that purchases a pump from our client will receive a report with identical information presented and that information will have been derived from the same calculations/algorithms.
- Reduction of the number of pumps in the production queue (and hence inventory) by roughly as much as 1/2 due to faster data acquisition and especially the archiving of the test results and the generation of the final report and its associated calculations.
System Overview
We developed the Pump Test Utility application to allow our client’s engineers and operators to:
- Run one of two guided tests that visually provides pump performance feedback during the test.
- Create a test configuration file based on an Excel template that will be used to store test data as well as generate a report.
The pump test software was developed in LabVIEW and interfaced with an Access database and Excel workbook to acquire the configuration information necessary to set up and run the required tests. The resulting data acquired during the test, both raw data acquired from the sensors and calculated data used to characterize the pump being tested, are saved to the Excel workbook. Both high speed (10 kS/s) and low speed (10 S/s) data are acquired and stored into one data file for archival storage and retrieval if additional analysis is required. The high-speed data are for vibration and sound measurements and low speed data are for pressure, temperature, RPM and flowrate measurements.
The pump test configuration is performed within the application from a series of drop down selections populated with sensors found in an Access database. The database is updated and maintained by the client through a series of user interfaces within the application. Once the test sensors and conditions have been selected, those selections are written to the Excel workbook for use in the reports.
The LabVIEW Report Generation Toolkit software was used to develop the reports the client provided to their customers. The Excel workbook template contained the formatting necessary for the reports. As the software wrote the data into the workbook, the reports were built from the formulas and formatting already configured in the Excel template. At the end of the test, the software printed the appropriate worksheets containing the elements of the report required.
| SOFTWARE FUNCTIONS |
|---|
| Data Acquisition |
| Test Sequencing |
| Metric or SAE Units |
| Multi-Level User Authentication |
| 2 Standardized Test Types |
| Generate Standard Table-Based Reports |
| Generate Pump Performance Graphs |
| Generate Vibration Graphs |
| Sensor Management Tools |
| Test Configuration Management Tools |
| HARDWARE USED |
|---|
| NI cDAQ Signal Conditioning Chassis |
| Variety of NI cSeries Signal Conditioning Modules |
| Pressure Sensors |
| Flowmeters |
| Vibration Sensors |
| Displacement Sensors |
| Temperature Sensors |
| Torque Sensors |
| Speed Sensors |
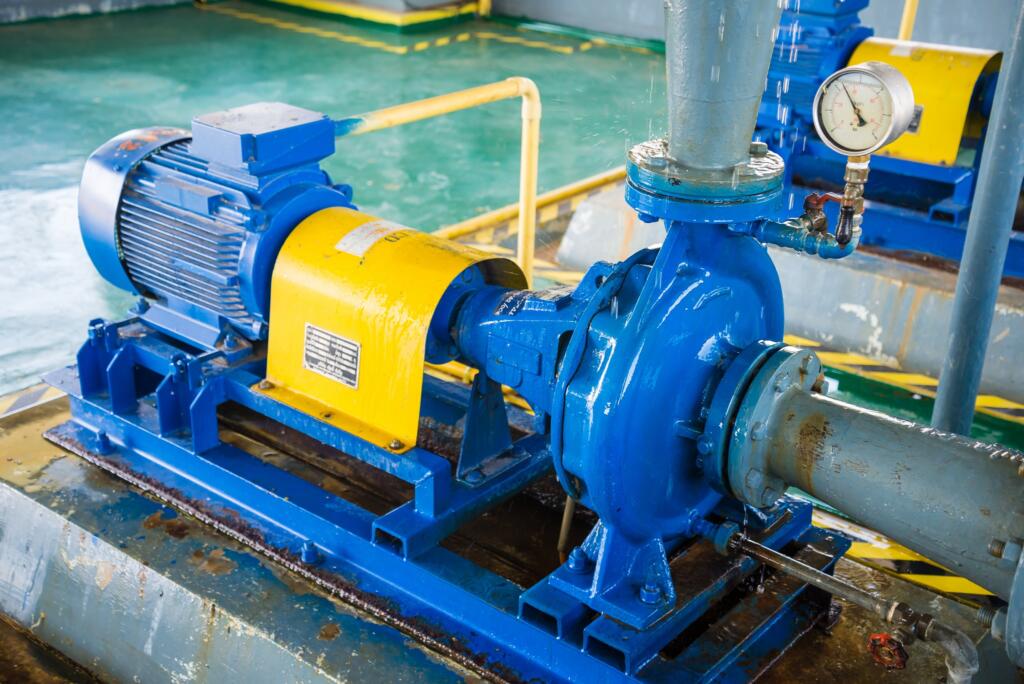
Pump Test Station Used Across Multiple Locations Worldwide
Pump Test Station Used Across Multiple Locations Worldwide

Client – ITT Goulds Pumps
Challenge
Pumps are used for everything from sump pumps for the consumer home market all the way to large pumps for industry capable of moving thousands of gallons per minute. Just as varied is the fluid being pumped: from water to slurries to hydrocarbon-based fluids.
Pump manufacturers typically build and test in plants across the world and each of those facilities is responsible for testing every pump manufactured at that site to ensure that the pump will perform as the customer expects. These tests are well defined and based on standards such as API, ANSI and other organizations. These standards provide test procedures but do not give details as to how to perform the tests. Each site typically tests their product without guidance as to how to satisfy the aforementioned standards. As a result, differing hardware and software solutions are usually put in place to test the individual site’s products.
Such varied testing systems make it exceedingly difficult to compare test results across testing sites, both within plants and between plants.
We were asked by our client to create a homogeneous test platform with which they could compare data across manufacturing plants and test sites within the plants as well as automate calculations of plant performance metrics and reporting.
This client engaged us to develop and implement a software and information storage solution that could run the prescribed tests on any testing site and make these data available to their engineers. These tests were to be semi-automated and guide the test operator through a test ensuring that the procedure and the resulting data were collected in the same manner on every test site, worldwide.
Solution
The Pump Test Globalization application consists of the following sub-applications:
- A Pump Test application that can run 1 of five different tests simultaneously to reduce the amount of time the UUT is under test. A separate data file is generated for each test and those data files are stored in the database along with the test results.
- A Test Configuration application that helps to manage the orders and the tests association with those orders.
- A Report Generation application that creates a report for each test run on a pump. Additional performance graphs are generated along with options for graphs depicting vibration and orbital performance of the pump.
Benefits
- Standardization of testing technique – now each pump will be tested with the same procedures and calculations/algorithms used are standardized across all manufacturing test sites.
- Standardization of report content and presentation – now every customer that purchases a pump from our client, regardless of origin of manufacture, will receive a report with identical information presented and that information will have been derived from the same calculations/algorithms.
- Ability to generate manufacturing performance data – metrics such as first pass yield may be calculated for all manufacturing sites. Data from all manufacturing sites may now be compared.
- Abstraction of data acquisition hardware – measurement data can be acquired from a variety of sources including OPC servers and NI DAQ Hardware. With this abstraction, the client’s existing hardware was reused where it made sense and replaced with new hardware as needed.
System Overview
We developed Pump Test, Pump Test Configurator and Pump Test Report Generator applications to allow our client’s engineers and operators to:
- Run one or a series of guided tests that visually provides pump performance feedback during the test.
- Configure a test for a specific pump model number and serial number. This configuration is read in by the Pump Test software to set up the test according to the configuration.
- Generate a report that would be sent with the pump to their customer showing how the pump performed and that it met the customer’s requirements.
The pump test software was developed in LabVIEW and interfaced with a SQL database to acquire the configuration information necessary to set up and run the required tests. The resulting data acquired during the test, both raw data acquired from the sensors and calculated data used to characterize the pump being tested, are saved to the database. Both high speed (10 kS/s) and low speed (10 S/s) data are acquired simultaneously and stored into one data file for archival storage and retrieval if additional analysis is required. The high-speed data are for vibration and orbital measurements and low speed data are for pressure, temperature, rpm and flowrate type measurements.
The pump test configuration software was also developed in LabVIEW and is a separate application that uses a SQL database on the back end. The database is located on a secure server and has been designed to retain the following information:
- Lists of all the manufacturing and test facilities.
- List for all the motors used for running the pumps.
- List for all the available sensors and hardware for each test station for every manufacturing plant.
- Ability to associate each sensor with a hardware channel for acquisition.
- Create and edit orders that contain pump specific information such as model number and serial number.
- Create and edit test configuration information for a given order.
The report generation software was also developed in LabVIEW and provides the user a means to create standard reports for each of the test types. Additional addendums to the standard report can be created to include graphs utilizing the high-speed data such as vibration and orbital information.
| SOFTWARE FUNCTIONS |
|---|
| Data Acquisition |
| Test Sequencing |
| Test Configuration Verification |
| Language Localization |
| Metric or SAE Units |
| Multi-Level User Authentication |
| 5 Standardized Test Types |
| Generate Standard Table-Based Reports |
| Generate Pump Performance Graphs |
| Generate Vibration and Orbital Graphs |
| Pump Order Management Tools |
| Sensor Management Tools |
| Test Configuration Management Tools |
| HARDWARE USED |
|---|
| NI cDAQ Signal Conditioning Chassis |
| Variety of NI cSeries Signal Conditioning Modules |
| Various OPC Servers for PLC Communications |
| Pressure Sensors |
| Flowmeters |
| Vibration Sensors |
| Displacement Sensors |
| Temperature Sensors |
| Torque Sensors |
| Speed Sensors |
| Request a Pump Test System Consultation |
|---|
We’ve helped teams at some of the world’s most innovative companies