Custom Electromechanical Test Systems
Over 1,500 electromechanical
test systems delivered
Some parts we’ve tested
How we can help: our capabilities & expertise
Some tests we’ve implemented
Want more proof points? Check out these electromechanical part case studies:

Validating firmware on a new controller for a mining vehicle
Validating firmware on a new controller for a mining vehicle
Combining VeriStand and TestStand to simulate subsystems for controller firmware testing
Client – A global supplier of heavy mining machinery

Challenge
The client was developing microcontroller firmware to manage part of their mining machine. This machine is too large and expensive to use for initial testing of the firmware. Instead, models were needed to simulate subsystems of the machine to test proper operation of firmware. And, the subsystems had to be sequenced through various states that the machine controller would encounter in actual use.
Solution
We developed a series of VeriStand models for the subsystems to run on a PXI RT controller. Then we developed some TestStand sequences to “drive” the machine through a set of simulations by setting the VeriStand model parameters. The sequences ran through certain scenarios to check performance of the controller firmware to a known sequence of conditions while validating the controller actions.
We acted as an extension of our client’s engineering team. Our client had engineering capabilities in VeriStand and TestStand to do the work themselves but did not have the capacity for the work at the time.
Benefits
Working Together
Our initial engagement with this team dealt with requirements gathering. We discussed managing this project with traditional Waterfall methods, where requirements are completed before going to design, but it was decided to manage closer to an Agile methodology, where we defined a short-term goal and adjusted subsequent steps as we progressed.
The main reason for this choice was that our client was busy developing the firmware at the same time Viewpoint was developing the simulation models. In other words, they wanted to “get going” in order to highlight design issues earlier than later.
The fact that we both had experience and knowledge about VeriStand and TestStand, made the status discussions quite technical and productive. Consequently, Agile worked well for this project.
How we helped
We helped our client in the development of their controller firmware by offering:
System Overview
The models we developed had to adjust their internal state to simulate the motion of the machine. The models reacted to messages from the firmware and passed back appropriate responses to the microcontroller.
The messages adhered to the J1939 CAN protocol. The models communicated to the microcontroller via PXI-8512 NI-XNET CAN modules in the PXI chassis.
The VeriStand models were all developed in LabVIEW for deployment on the PXI RT target running the VeriStand Engine. We were able to leverage a VeriStand custom device for J1939 previously developed by NI and hosted on GitHub. This code was useful because we had to extend the standard X-NET for this project . TestStand, VeriStand, and some Python code ran on a separate PC connected to the PXI RT controller to round out the testing environment.
The vehicle model received some digital signals for low level safety redundancy in case somehow the comms stopped functioning. For example, a digital heartbeat was output and some digital signals from the controller were used to indicate low-level state such as E-stop.
The TestStand sequences covered a wide range of motion situations and we expect that our client will create additional sequences for different simulations once we’ve completed the system foundation and essential test plans.
This table lists the main components used in this test system.
| SOFTWARE FUNCTIONS |
|---|
| LabVIEW |
| VeriStand |
| TestStand |
| Python |
| HARDWARE USED |
|---|
| PXIe-1088 Chassis |
| PXIe-8822 Controller |
| PXI-6511 Digital Inputs |
| PXI-6512 Digital Outputs |
| PXI-8512 CAN |
Transonic Wind Tunnel Test System Upgrade
Transonic Wind Tunnel Test System Upgrade
Improved Reliability, Reduced Stress, and New Tools People Want to Use.
Client – Calspan
(tunnel image courtesy of Calspan)

Challenge
Calspan operates a transonic wind tunnel capable of continuous Mach-speed testing a wide range of aircraft designs.
The overall test system was comprised of three subsystems that were all state of art at the time of design, over 20 years ago, but components were either obsolete or soon becoming so.
Calspan contacted us, and others in a competitive bid, to design, reuse, replace, and build a new test stand to maintain and even upgrade the test capabilities. At a high level, the requirements were to provide similar signal conditioning, hardware functionality, and software user experience.
Working together
Collaboration between our teams was key to success for this upgraded test system.
From the start, we all agreed that we’d have to do some reverse engineering to extract the details and nuances of the existing test system. This task was accomplished by reviewing existing items such as documentation and C++ code. As anyone who has done obsolescence upgrades knows, sometimes the source code is the best source for system requirements due to the wealth of details inherent in source code. Also, some aspects of system operation could not be easily documented, and Calspan personnel helped with defining the desired user interface and user experience.
The reverse engineering effort was enlightening and critical to assure that we all knew where we were headed.
Some highlights of design topics on which we collaborated:
The balance between full automation and manual operation was also discussed during initial collaboration. Calspan felt more comfortable with, and was familiar with, operating in a semi-manual mode, where walking through a test sequence was best handled semi-automatically with a set of operators at their stations. Nevertheless, we were able to suggest some improvements to the system useability and extensibility. For example:
Overall, we followed an iterative, Agile-like approach to design while using the technical details of the existing hardware and source code from the three subsystems to dictate the requirements necessary to reproduce, and even extend, the existing functionality.
Solution
The data acquisition part of the test system was implemented in two parts:
- a Precision Filters, Inc. (PFI) signal conditioning front end and,
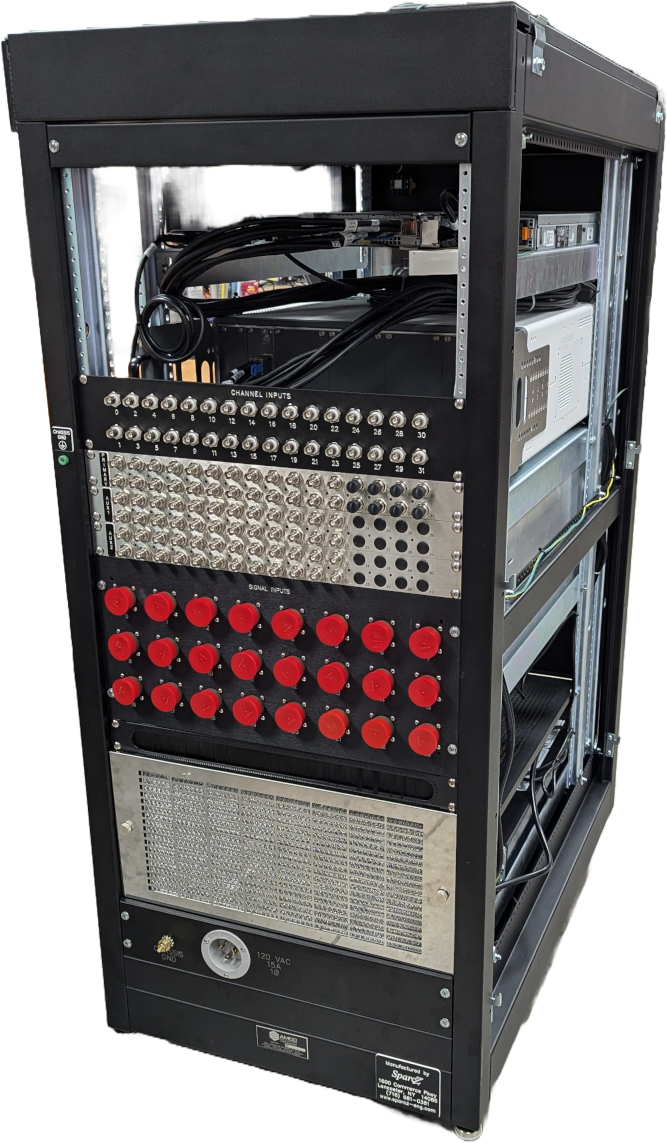
- a National Instruments PXIe data acquisition chassis and modules. The PXIe chassis is connected to a server-class PC with MXI to handle all the acquired data and communication messaging between this test system and other special instruments and subsystems.
The signal conditioning was implemented with 128 channels of Precision Filters, Inc. 28124 transducer conditioner. This hardware is the only equipment on the market that met the needs of the client due to its capabilities for voltage and current excitation and a slew of gain and analog filtering options. PFI equipment is used extensively in wind tunnel and other critical measurement applications where performance, stability, and reliability are crucial, so the fit made a lot of sense. Also worth noting, although PFI offers an API to their chassis to enable automated or interfaced calibration, we chose to use their native calibration application because it just works and our interface would have been just a thin shell talking to their software.
The PXIe data acquisition is comprised of 128 channels of 24-bit, 200 kS/s digitizer analog input and additional 24-bit, 5 kS/s digitizer analog inputs. The PXI equipment is connected to a server-class PC via an MXI interface. The MXI interface offered the required bandwidth, and the server-class PC had plenty of processing power to manage the data flow from A/D to file storage while tending to the user displays. This arrangement is capable of simultaneous processing, alarming, visualization, and storage to disk at full rate.
Software was implemented almost entirely using Visual Studio C# and .NET 8.0. A small, but important, signal transformation portion was developed in LabVIEW Real Time on a Compact RIO.
User interface, test and sensor configuration, data acquisition, data processing, data storage, force balance calibration and alarming are all implemented in .NET.
Another overall goal was Calspan’s desire to maintain the application software. We tackled this goal in two ways:
- First, the original software spanned 4 code bases: 3 for the 3 subsystems mentioned above and 1 for calibration measurements. Not an ideal arrangement for software maintenance. When we rewrote in C#, the code base was refactored so that common software classes could be shared, such as data acquisition functionality.
- Second, it is very typical that Calspan’s customers have some unique measurement requirement such as specific sensor selection or additional measurement or control equipment. These requests are more easily accommodated by Calspan now, as compared to the previous system, because the refactoring and combining of the apps simplifies code edits.
Benefits
The main benefits of this obsolete test system upgrade were:
Also important to mention is the benefit of working with a collaborative team. The existing system, composed of the multiple subsystems, was complex with many subtleties. As with many older systems, the existing documentation was missing some important requirements – it’s just plain hard writing requirements. Without Calspan and Viewpoint having an open dialog and willingness to spend the time to understand options and make appropriate tradeoffs, the benefits of this upgrade project would not have been realized as cleanly. The collaboration was especially important in the design and acceptance testing phases of the project.
With this upgrade, Calspan has a reliable and flexible testing platform.
The previous hardware was degrading and, while not preventing tests from proceeding, channels were increasingly unusable as they failed. The replacement data acquisition hardware upgrades the previous test system with 128 high-speed channels, up from 96, and adds 32 low-speed channels. Previously, the test system acquired these high-speed channels at 100 kS/s per channel. Now the high-speed channels can be acquired at 200 kS/s per channel. All channels are now at 24-bit resolution up from 16-bit, vastly improving dynamic range. Finally, the fast- and low-speed channels can be combined into 160 channels of low-speed data with alarms (via real-time signal processing).
This new and modernized wind tunnel test system also brings faster test configuration. Calspan noted to us that two of the biggest improvements for a test setup configuration are having software-selectable filtering (i.e., not needing to change hardware modules) and having integrated multi-rate data acquisition (i.e., without having to patch in and set up separate acquisition hardware). Calspan estimates saving 2 to 4 hours per test setup.
Moving forward, Calspan will be able to satisfy their customer’s needs with this improved test system performance and the ability to reconfigure or expand functionality for future programs.
How we helped
System Overview

| SOFTWARE FUNCTIONS |
|---|
| Channel configuration |
| Alarming |
| Real-time graphs |
| Calibration for 6-axis and 1-axis sensors |
| Data storage |
| HARDWARE USED |
|---|
| Dual 19″ rack test stand |
| Precision Filters 28124 modules, 28000 chassis, and associated connectivity hardware |
| NI PXIe modules and chassis for high-speed AI |
| NI cDAQ and cRIO for AIO and DIO |
| Server-class PC |
Enhancing an existing test system for ease of maintenance
Enhancing an existing test system for ease of maintenance
Reduction of time and frustration motivates software upgrade of a capable but inflexible test system
Client – A world-wide manufacturer of refrigeration units
Challenge
Our client had been using a 15-year old test system LabVIEW-based application that was becoming difficult to update. Plus, the designs of their newest refrigeration units were more complex than ever, requiring new test steps.
On top of that, our client wanted to give the operator flexibility in sequencing the test steps. For example:
- the operator might want to run a specific test twice to verify operation,
- the operator might want to restart a sequence in the middle after reworking a part, or
- the test engineer might want to add another test step to further clarify operational data for historical trend analysis.
The existing application was based on a state machine architecture. While state machines can be edited to handle different sequence flows, this test application had numerous alterations over the past 15+ years to support the needs for testing new product designs. These amendments compounded over the years into an unwieldy test application.
New products were about to be introduced which would require additional modifications to the existing state machine and subsequent verification that:
- changes worked as planned and
- changes didn’t affect any other existing modes of operation. This need was increasingly daunting.
The Design and Development Process
Very early in discussions, we showed our client a test application based on an object-oriented (OO) software architecture, and its associated user interface, that we had used in previous test system projects for other clients. We thought it might satisfy some of the desires we were hearing about:
- how the older state-machine-based test system was difficult to maintain,
- how some users were frustrated by the inflexibility of the test sequencer, and
- wondering why the system can’t be easier to update for new product requirements.
Moving the existing application over to this new architecture would clearly require more effort than another patch, so we had to decide if the cost for this approach would be justified based on two major benefits:
- Simplify the management and verification of future changes.
- Enable flexible test flows to give the test operator a better user experience.
Both benefits would accumulate cost savings for maintenance and upgrades going forward. After discussions with our client, we jointly decided this approach was justified.
After reviewing this OO approach, our client asked us to use it to develop a small test system for another component of the refrigerator products. This small system gave our client the chance to explore the “look and feel” of this new architecture and user interface design before embarking on the test system discussed in this case study.
That trial project was a success, and we were given the go-ahead. The benefits, as described above, were clear.
After the development was complete, we:
- worked with our client on integrating the test system into the existing test station,
- performed acceptance testing, and
- delivered the final items, like source code, to our client.
Solution
The initial upgrade tasks in creating this new application started by identifying the code for the test steps in the existing test application, which was based on that state-machine architecture, and then rewriting the test step functionality with the OO methodologies discussed earlier.
We also reworked the sequencing of steps to use an OO-based test sequencer. The test sequencer was reused from some of our prior projects.
For each test step in the existing test application, we repurposed the existing LabVIEW code in two ways:
- First, we identified code functionalities that were commonly used throughout the state machine for the purpose of defining a set of reusable step types.
- Second, we converted that common functionality into LabVIEW classes via copy-paste into the class methods, coupled with extraction of the configuration parameters needed to give each class the behavior needed for a particular step.
For example, the existing state machine contained many steps that provided a request-response method over a data bus. These similar steps were corralled into a single class with methods for data communication. Thus, each of the multiple original states in the existing application which requested parameter values could be made by calls to the same class in the new application simply by providing specific configuration inputs to the same class method.
Benefits
This OO design simplified updates to the test steps and their sequencing.
Furthermore, the operator interface was simpler, cleaner, and allowed the operator to manage the flow of the test steps. For example, operators could jump around in the test sequence when needed, say for reviewing the occasional confusing result or helping to develop the production test sequence.
The OO design of this new test system application was aimed squarely at improving the user experiences of both the operator and test engineer. Secondarily, the OO design will help the test system developer by untangling the original state machine code into supportable, extensible, and maintainable software.
Some specific benefits available from this new OO design:
- Reduced frustration – If the operator noted something confusing about the outcome of a test step, that step can be rerun without needing to restart the entire test sequence.
- Improved operational efficiency – The operator and/or test engineer can try a different sequence of test steps for operational or efficiency improvement.
- Faster test system updates – Two aspects make updates faster and cleaner. First, new product designs can be accommodated with less worry about whether the fragile state machine code will break, Second, the code modularity of OO test steps makes it easier to implement new tests.
These usability and maintainability features will save our client cost and schedule in future product upgrades as well as highlight the contributions of the test system on production efficiency.
System Overview
The test hardware was based on NI CompactDAQ and the application was written in LabVIEW. The automated test system provided the following main features:
- Test configuration based on the type of part being tested
- Test sequencing with part-specific test steps
- Test sequence execution can be managed by the operator in real-time
- Display of test results as the sequence progresses
- Archiving of test data for historical tracking
The test flow that this application runs is:
- The operator enters the model and serial numbers (typed in or scanned in).
- The test system looks up the model number and finds the test sequence to run.
- The test system populates the sequencer screen with the appropriate test sequence.
- The operator can select a step from which to start or just click the Start Test button to begin the entire sequence.
- Buttons at the bottom of the sequence display allow the user to Pause, Abort, or Resume the sequence.
- Executed test steps are highlighted in green (pass) or red (fail) to indicate how the sequence is progressing. The operator can scroll through the test sequence to review the outcome of each step.
- If the sequence is configured to do so, the sequence may pause at a failed step so the operator can repair and retest that step.
The unit under test (UUT) was monitored by the test system to view sensors both internal and external to the UUT. The external sensors are used to detect the environment of the unit, such as being in position, connected to power, and so on.
Besides a few thermocouples and digital inputs, measurement data used to determine pass/fail was obtained from the UUT via the data bus.
All these inputs were handled by a set of NI modules in a 4-Slot cDAQ chassis.
| SOFTWARE FUNCTIONS |
|---|
| Data communications |
| Acquire sensor data |
| Control digital output |
| Acquire digital inputs |
| Test sequence management and execution |
| Archiving of all test results |
| HARDWARE USED |
|---|
| 1 Port High Speed Communication Module |
| 8 Channel AI Module |
| 8 Channel Sourcing DO Module |
| 8 Channel Sinking DI Module |
Automated Measurement System – Verifying Flow Rate Performance in a Medical Device
Automated Measurement System – Verifying Flow Rate Performance in a Medical Device
Assessing quality and managing traceability of a medical device
Automation increases throughput by testing multiple units independently
Client
Worldwide supplier of products for surgery
Challenge
Our client wanted to perform detailed quality checks on the performance of some of their fluid dispensing products. These products dispense fluid over long periods of time (hours) so rigorous testing of each unit in production would take too long. But, being medical devices, these products need to follow ISO 28620 standards and FDA 21 CFR Part 820 regulations, so a rigorous test process is helpful to fulfill these needs. The automated test system below is part of that overall fulfilment.
The client came to Viewpoint with the following high-level desires for a system to test the product:
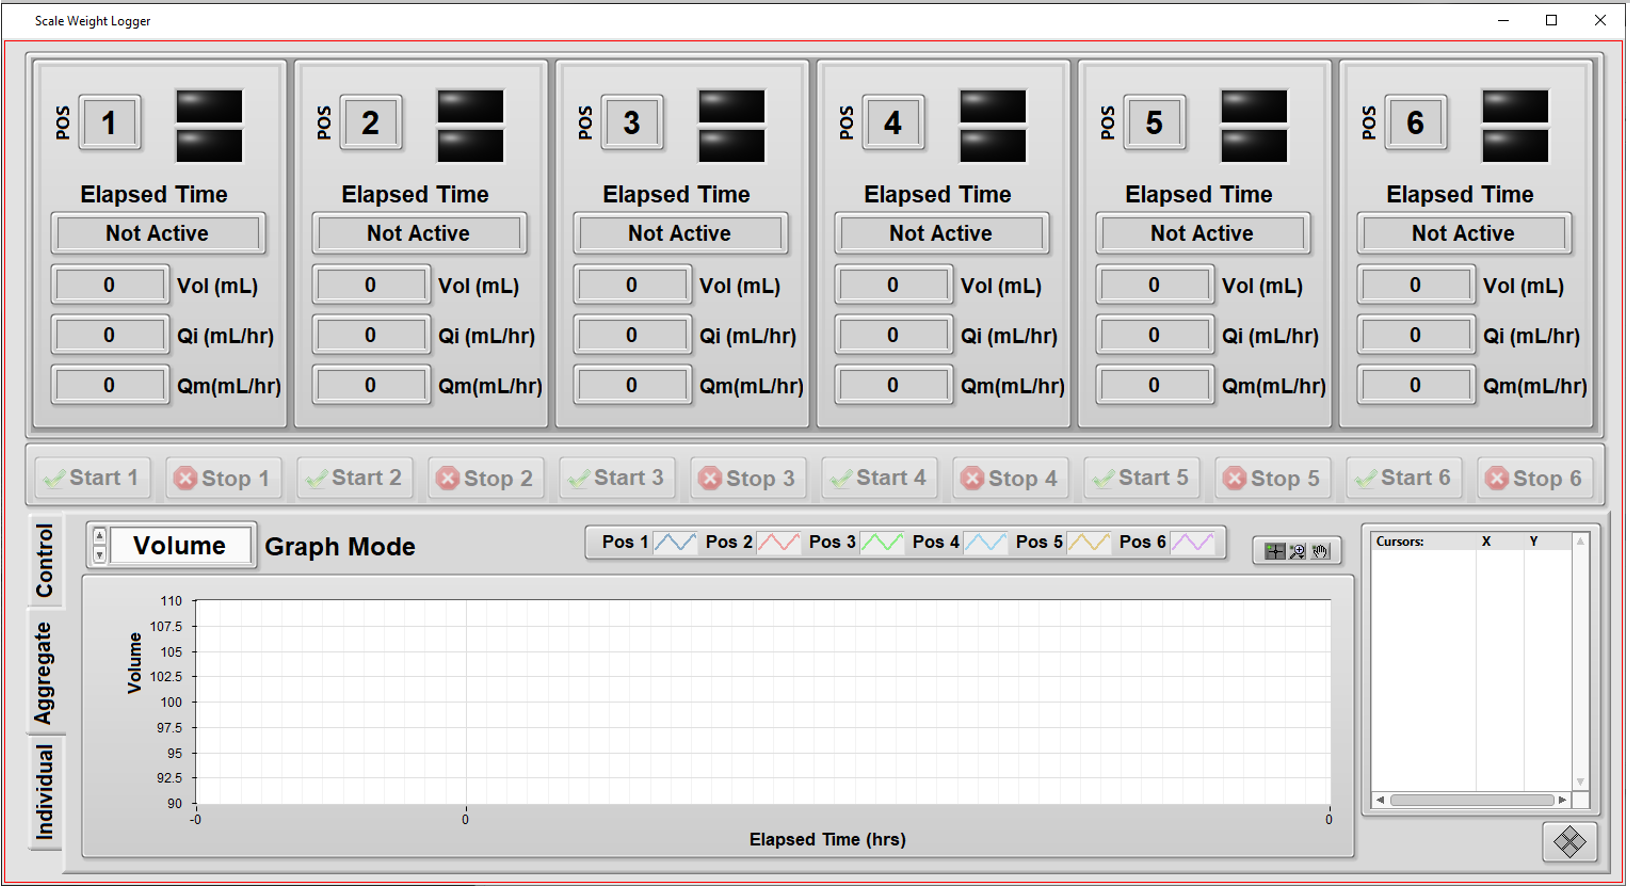
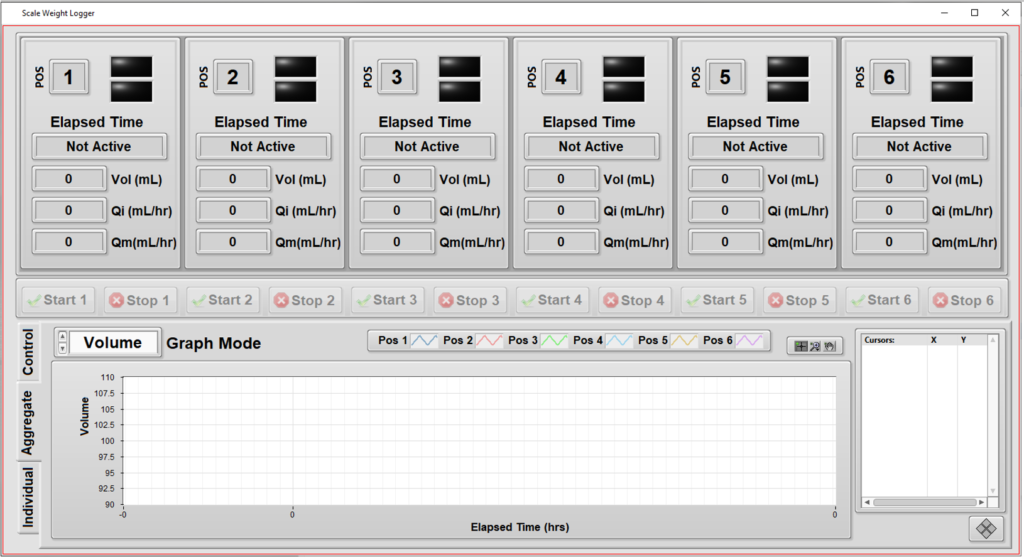
- Support independent configuration and testing for up to 6 units.
- Simplify overall test setup by copying the configuration from one unit to another.
- Handle different volume amounts supported by assorted models.
- Measure from each unit the weight of fluid dispensed as a function of time. (Weight was converted to volume using the fluid density.)
- Compute the “instantaneous” flow rate (volume vs time) as the test progresses.
- Keep track of the calibration status of the weight scales at each of the 6 positions in the test system.
- Enable some measurements to be excluded at the start and end of the run for calculations of average flow rate.
- Provide graphs and metrics of results to enable faster review of the data during the test.
- Add ability to comment on each unit while testing is in progress, and after, and track these for compliance.
- Print (PDF) a report on each unit’s results along with its identifying info, such as subcomponent lot numbers, the test datetime stamp, and the operator’s ID.
Solution
The client had an initial version of the testing application which they developed for testing their various initial design iterations. Viewpoint enhanced this existing application with the features listed above. The motivations for this enhancement were to:
- Automate testing of the initial production units more thoroughly than the existing application allowed.
- Enhance the user experience for easier testing.
A major aspect of the user experience was to support testing of multiple units independently from each other so that unit testing on one device could start/stop while other devices were installed in (or removed from) the tester without interrupting tests on other units.
- This need was especially important since some models might take twice as long to test as other models or the setup of one unit might need additional adjustments before starting. This meant that starting and stopping all at the same time could reduce utilization of the tester, and it made sense to have independent and parallel operation.
- Furthermore, with parallel testing, the tester was not constrained to having a full set of units to begin testing operation, since the tester could run with only 1 unit installed.
The other major enhancements focused on the user experience by offering real-time data of a particular unit’s testing, as well as real-time graphs to show progress. These graphs were useful because the operator could clearly see when a unit was not performing as expected and the test for that unit could be aborted without affecting testing on the other units.
Since this testing needs to follow the requirements in the ISO 28620 standard and 21 CFR Part 820, it was important for the application to be aware of the calibration status of each of the 6 weight scales, one for each position in the test system.
Benefits
The main goal of this project was to augment the test operator’s ability to set up the testing of products while providing real-time visual feedback to the operator about the testing status.
Some of the benefits of this automated test system were:
- The test automation provided consistency resulting from the software-enforced test process.
- Test status via the visual feedback helped increase the efficiency of the operator.
- Enhance the user experience for easier testing.
System Overview
The application was developed in LabVIEW and measurements were made via RS-232 communications to each of the 6 weight scales. Once a unit was installed in the tester and the operator started the test on that unit, the application:
- tared that unit’s scale,
- started the flow,
- and collected weight measurements frequently to build a curve of “instantaneous” flow versus time.
These “instantaneous” flow numbers were used to compute statistics such as maximum flow and average flow over the course of the entire test run.
Some of the primary functionality of this system includes:
- Independent tests: testing a specific unit doesn’t interfere with testing of others.
- Graphs of flow rate during the test execution: visualize the unit’s performance during the hours-long test time, not just at the end.
- Calibration check: the next calibration date of each of the weight scales are maintained in a configuration file, so the operator can check that the test system is ready to run a test at a particular position.
- Different volumes: since each unit is tested independently, the system can handle different volumes for each position in the tester.
- Enhanced commenting: operators can enter comments about each unit (or all of them) and have these comments archived for compliance purposes.
| SOFTWARE FUNCTIONS |
|---|
| Logging of weight versus time for up to 6 test positions via RS-232 communications to scales. |
| Manage the configuration and commenting of the test. |
| Save, recall, and copy configuration information to ease the operator’s setup effort and time. |
| Display graphically the curves of flow versus time while the test progresses. |
| Compute statistics on the flow after test completion. |
| HARDWARE USED |
|---|
| Multiport ethernet to RS-232 serial communications. |

Custom Automated Test System – Quantifying Energy and Durability Performance for Refrigeration

Custom Automated Test System – Quantifying Energy and Durability Performance for Refrigeration
Automation reduces manual labor while improving traceability
Assessing performance for improved energy ratings and longevity
Client – Zero Zone – Commercial refrigeration systems manufacturer
Challenge
Zero Zone wanted to improve the capabilities and durability of their new reach-in refrigeration products.
You might think that refrigeration is a mundane product line, but that is just not true! So many innovations are occurring as manufacturers are redesigning their products to improve their environmental footprint through better energy efficiency, coolants, and durability.
Assessment requires an understanding of the performance of the refrigeration units under many conditions. Zero Zone was taking measurements with a datalogger with too few channels, and no synchronization, to other devices that feed into the system. Plus, they had multiple models of their reach-in refrigerators that needed to be assessed. Furthermore, simplifying the data collection and analysis would make it easier to validate against ASHRAE standards.
Zero Zone came to Viewpoint with the following high-level desires:
- Expand the measurements by adding more channels and channel types (e.g., 4-20 mA, ±10 VDC and digital I/O).
- Provide graphs and KPIs to enable faster analysis of the data during the test.
- Minimize the chance of data loss during long test runs.
- Synchronize data collection and actuation.
- Automate storage of measurements per a user-defined period to eliminate manual start/stop of data collection.
- Simplify the manual configuration setup.
- Enable a way to find relevant data perhaps months or years after the test run.
Solution
Viewpoint developed a monitoring and control durability test system that could exercise Zero Zone’s refrigerators through hundreds of operation cycles over multiple conditions to simulate actual usage in, for example, a grocery store.
During initial conversations, we collaborated closely with Zero Zone to brainstorm on some potential approaches. We made some suggestions that could satisfy their desires while also managing their time and cost budgets. Part of that process involved helping Zero Zone in the selection of the cSeries modules, to assure the most effective modules balancing cost per channel, connectivity, and anticipating some possible future needs.
As an example, by automatically populating the cells in an Excel template based on their original systems’ Excel spreadsheet, we provided streamlined report generation without having to rewrite all the calculation code embedded in their Excel file in another app. The compromises we jointly endorsed were:
- Run an app on a PC to configure and monitor the test.
- Use both NI Compact RIO and Compact DAQ to enable robust and synchronized data collection and control with the ability to expand channels by adding modules in both the cRIO and cDAQ chassis.
- Store data on a local PC rather than a remote server to minimize the probability of data lost during the test run.
- Save configurations into Excel files for recall, and cloning, of prior setups.
- Write measurements automatically into the same Excel file for archive of the test setup and measurements.
- Create, in this same Excel file through cell formulas, the summary report from the summary calculations. This approach allowed flexibility for changes to internal and external test standards.
- Upload the summary data and test reference info into a SQL database for data management and long-term test statistics.
Digital outputs (DOs) were used to control various aspects of the test, such as door open/close and defrost on/off cycles. For flexibility, the user can specify the sequencing of these DO channels, in the Excel file used for the test, with various parameters that define the duty cycle, period, number of cycles, and start delay. The timing of these DO state changes was synchronized to the data acquisition by the real-time loop in the cRIO.
This system was deployed to 6 test bays, each one of which might be testing a unit for as little as a few weeks or as much as a few months.
Benefits
The main goal of this project was to reduce the effort and associated human error in the design and execution of the test run.
Some of the primary benefits for this automated system were:
- Reduced Errors: pre-verified template files used for test configuration and data storage lent consistency to test setup and execution.
- Less Testing Time and Effort: the automatic execution of the test and storage of measurements enabled running tests for multiple days (and nights) without technician interaction. Technicians could work on setting up other units for test rather than babysit the existing test. On average, based on the duration of the test time, testing throughput increased by approximately 25% to 40%.
- Shorter Reporting Time and Effort: reports were available about 85% faster than the time previously spent creating manually. The quicker feedback saved costs through early detection of unit problems and faster teardown at the end.
Some additional major benefits were:
- More details on refrigerator operation: “Wow! We never saw that before.”
- Database consolidation: statistical analysis takes hours not days and includes all tests run in the lab, not just ASHRAE tests. This central database enables long term retrieval of all test data.
- Reuse: techs embraced ability to reuse and modify previous setups.
- Consistency: driving the test definition through an Excel file encouraged uniformity.
- Traceability: documented and timestamped calibration measurements.
- Flexibility: channel counts, acquisition modules configuration, calibration, and calculation formulas were straightforward to change for new test setups.
The test automation provided by this system greatly reduced the labor involved in configuring, running, and analyzing the test run. Furthermore, the customer benefited from the consistency that resulted from the software-enforced process.
System Overview
We developed the application in LabVIEW and LabVIEW RT combined with a cRIO connected to a cDAQ via TSN Ethernet.
The data acquisition modules slotted into the cRIO and cDAQ chassis handled the I/O to the customer sensors and actuators. The sensors mostly measured:
- temperature,
- pressure,
- flow,
- power, and
- voltage.
| SOFTWARE FUNCTIONS |
|---|
| Data logging of between 50 and 150 channels and control via digital signals |
| Interface with Excel files for configuration, data logging, and summary calculations |
| SQL database for summary and test setup data |
| Real-time loop for robust operation |
| HARDWARE USED |
|---|
| NI cRIO 8-slot chassis, TSN enabled |
| NI cDAQ 8-slot chassis, TSN enabled |
| Various NI cSeries signal conditioning modules |
Replacing Wire-wrap Boards with Software, FPGAs, and Custom Signal Conditioning
Replacing Wire-wrap Boards with Software, FPGAs, and Custom Signal Conditioning
Electronic components of fielded systems were aging out
Reverse engineering effort converted wire wrap boards to FPGA-based I/O
Client – Amentum – A supplier for Military Range System Support
Challenge
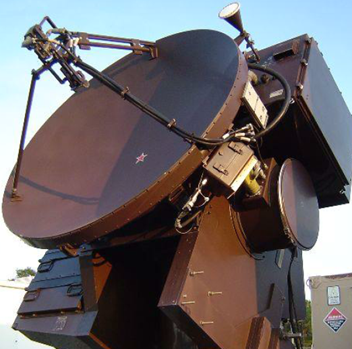
Amentum (www.amentum.com) supports a decades-old system deployed in the early 1980s. While the mechanical subsystems were still functioning, the wire-wrapped discrete logic and analog circuitry was having intermittent problems.
Systems designed and built decades ago can sometimes have wonderful documentation packets. Nevertheless, we’ve been burned too often when the docs don’t incorporate the latest redlines, last-minute changes, or other updates.
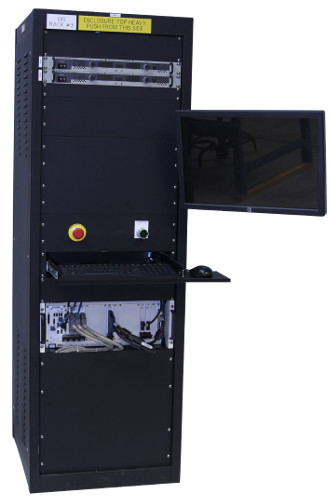
The replacement system needed to be a form-fit-function replacement to land in the same mounting locations as the original equipment with the same behavior and connections. Below is an image of the existing wire-wrap boards and their enclosure. We had to fit the new equipment in this same spot.
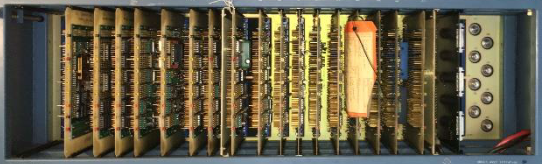
Figure 1 – Original wire-wrap boards
Finally, Amentum wanted to work with Viewpoint in a joint development approach. While our joint capabilities looked complementary, we didn’t know at the start how well we would mesh with our technical expertise and work culture – it turns out we worked extremely well together as a team and neither one alone could have easily delivered the solution.
Solution
Since the team treated the existing documentation package with suspicion, we adopted a “trust but verify” approach. We would use the documents to give overall direction, but we would need details from the signals to verify operation.
Leveraging Amentum’s experience with the fielded systems, the team decided early on to record actual signals to understand the real I/O behavior. We used the system’s “test verification” unit to run the system through some check out procedures normally run prior to system usage. This verification unit enabled us to use a logic analyzer for the I/O to and from the discrete logic digital signals and an oscilloscope and DMM for the analog signals. The available schematics were reviewed to assure that the signals made sense.
With a trustable understanding of system operation, Amentum created a requirements document. We jointly worked on the design of the new system. There were both an “inside” system (in a control shelter) and an “outside” system (in the unit’s pedestal).
Some overall tasks were:
- Viewpoint recommended an architecture for the inside application running on PXIe LabVIEW RT and FPGA layers.
- Amentum created the system control software on a Linux PC.
- Viewpoint developed the more intricate parts of the inside application and mentored Amentum on other parts they developed. This work recreated the existing discrete logic and analog I/O using PXIe NI FPGA boards.
- Viewpoint designed custom interposer boards to connect harnesses to the NI PXIe equipment, including a test point and backplane boards.
- Amentum designed and developed the cRIO-based outside system application and Viewpoint created a set of custom interposer boards to connect harnesses to the cSeries modules.
Critical to this project was our hardware selection services. By combining our engineering skills for the reverse engineering of the legacy electronics with our knowledge of the NI hardware, we narrowed the hardware choices to a few NI FPGA boards.
These PXIe FPGA boards and cRIO FPGA-backed modules handled the required 60 MHz clock-derived signals with correct phases, polarity, analog inputs, and so on. Furthermore, the wire-wrap boards were register-based so the PXIe had to decode “bus signals” sent over a Thunderbolt bus to emulate the programming and readouts from the various wire-wrap boards.
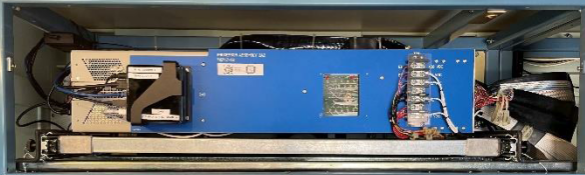
Figure 2 – PXIe replacement to wire-wrap boards
Amentum wanted to be able to support the LabVIEW FPGA VIs used to replace the functionality of the discrete logic. So, Viewpoint acted as mentor and code reviewer with Amentum to ramp them up on using LabVIEW FPGA effectively. Neither one of us alone would have been successful coding the applications in the allotted time. Joint knowledge and experience from both Viewpoint and Amentum were required.
Signal conditioning and harnesses needed to be reworked or replaced as well, of course, since the landing points for the wires were different in the new system. Viewpoint suggested a technique, which we’ve used frequently in past obsolescence upgrade projects, to create PCB boards that accepted existing connectors.
For the cRIO, these interposer “connection” PCBs plugged directly into the cRIO cSeries module. For the PXIe, these interposer PCBs accepted the field wiring connectors and converted them to COTS cables that connected to the PXIe modules. These interposer PCBs could have signal conditioning incorporated as needed. This approach significantly reduced the need for custom harnesses. All told, about 200 signals were passed between the PXIe and various other subsystems, and about 100 for the cRIO. This approach saved significant wiring labor and cost.
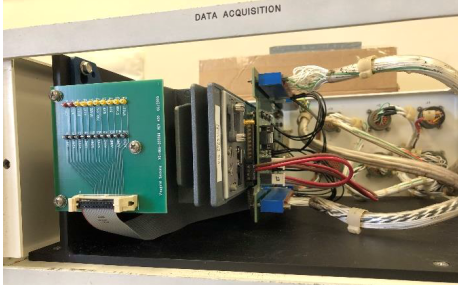
Figure 3 – cRIO with interposer boards between cSeries and field harnesses
The work to design and build the signal conditioning custom electronics was split between Viewpoint and Amentum. Viewpoint did more design than build and handed over the schematics and Gerber files to Amentum so they could manage the builds while also being able to make modifications to the boards as needed.
Benefits
Amentum wanted an engineering firm that was willing to work along side them as a partner. Joint discussions about architecture and design led to a collaborative development effort where Amentum benefited from Viewpoint’s extensive expertise and guidance on LabVIEW architectural implementation and FPGA coding style.
The main outcomes were:
- As a partner of the team, Viewpoint acted as staff augmentation by providing experienced engineers with technical capabilities that Amentum initially lacked.
- This team approach delivered a stronger product to the end-customer more quickly than either of us could do alone.
- The combination of Viewpoint’s and Amentum’s experience reduced the amount of reverse engineering needed due to the lack of firm requirements.
- Reduction of electronics obsolescence by using software-centric FPGA-based functionality. Recompiled LabVIEW FPGA could target future boards models.
- Increased software-based functionality simplifies future updates and modifications.
- Decrease in number of parts leading to simpler maintenance.
- Lower wattage consumed eliminated need for an anticipated HVAC upgrade.
- Cybersecurity concerns were reduced by using Linux-based systems and FPGA coding.
System Overview
Using software to emulate the old hardware was a critical success factor. Since the requirements were not 100% solid at the start of the project, some field-testing was required for final verification and validation. The flexibility of the software approach eased modifications and tweaks as development progressed. A hardware-only solution would have necessitated difficult and costly changes. For example, some of the changes occurred very near the final deployment after the system was finally connected to an actual unit in the field.
| SOFTWARE FUNCTIONS |
|---|
| Emulate original discrete logic functions via FPGAs |
| Emulate original analog signal I/O |
| Overall system control via Linux PC |
| Maintain the same user experience as existed before |
| Modern application architecture for simpler maintenance |
| HARDWARE USED |
|---|
| NI cRIO chassis with various cSeries modules |
| NI PXIe chassis with FPGA modules to handle all the analog and digital I/O via a combination of multifunction and digital-only cards |
| Custom PCBs for signal conditioning and connectivity |

Enhanced Portable Data Acquisition and Data Storage System
Enhanced Portable Data Acquisition and Data Storage System
Using a Real-Time Operating System (RTOS) provides a high level of synchronization and determinism for acquired data.

Client
Tier 1 Automotive Design and Manufacturing Supplier
Challenge
Our client had an existing data acquisition system, used for mechanical product validation testing, that had undergone many updates and patches for over 15 years. These updates and patches, performed by multiple developers, had rendered the software portion of the system somewhat unstable. Furthermore, the system hardware was based on NI SCXI, which was becoming obsolete. These issues prompted our client to migrate to an entirely new system.
New requirements for this upgrade included utilizing a PXI controller running NI Linux Real-Time, a RTOS, executing a LabVIEW RT application. Selection of the replacement NI hardware required knowledgeable engineering to assure compatibility between the selected NI hardware and the legacy SCXI equipment. Part of that compatibility assessment included an understanding of the software application so we could know for certain how the SCXI equipment was used. A blind selection based entirely on hardware specs would have missed nuance, such as the need for synchronized acquisition.
The data acquisition software had to support a variable mix of signal conditioning modules in the PXI chassis. In addition, the data acquired from these signal conditioning modules needed to be synchronized within microseconds.
Solution
Viewpoint leveraged another application, developed for the client a few years prior, to harmonize the user interface and to reduce development effort. Most of the development time focused on support and configuration of the multiple module types and ensuring that the data synchronization functioned as required. The result was an ultra-flexible, portable, high-speed data acquisition software/hardware combination that can be used to acquire time-sensitive, synchronized data across multiple modules in a PXI chassis running a real-time operating system.
Benefits
The upgraded system offers the following features:
- Highly configurable real-time data acquisition hardware/software solution based on LabVIEW RT and PXI hardware. Our client works closely with OEMs to assure compatibility and durability with their products, often going to the OEM’s test cells to collect performance data. The configurability in modules and channels affords the fastest possible setup at the OEM’s site which minimizes time and cost in the test cell.
- Configuration files stored in a SQL database format. Saving channel and module setups in SQL allows the test engineer to locate previous hardware and data acquisition configurations. The usual alternative is a bulk save of an entire system setup rather than using a more granular, and hence, more flexible approach afforded by using the database.
- Immediate test feedback through graphs and analog indicators, used to assure data quality before leaving the test cell.
- Data playback features after the data has been acquired, used for in-depth review of data after leaving the test cell.
- Data acquisition on the RTOS provides assurance that the acquisition will not be interrupted by network or other OS activities, which was occasionally an issue with the prior Windows-based application.
- Synchronization between signal conditioning modules ensures time-critical data taken on separate modules can be compared and analyzed.
System Overview
The system consisted of custom LabVIEW RT software intended to run on an engineer’s laptop and the PXI real-time controller and a PXI chassis populated with a flexible assortment of NI signal conditioning modules (provided by the client).
The software used an object-oriented Actor-based architecture, which facilitates adding new signal conditioning modules and flexible communications between the host PC and the real-time controller.
| SOFTWARE FUNCTIONS |
|---|
| DAQ Task Configuration |
| Event-Based DAQ Trigger |
| Data Synchronization |
| Real-Time Data Visualization |
| Data File Playback Utility |
| Datalogging to TDMS File |
| HARDWARE USED |
|---|
| PXIe Chassis (4,9 or 18-Slot) |
| PXI Real-Time Controller |
| PXI Multifunction I/O Module |
| PXI Digital I/O Module |
| PXI Counter/Timer Module |
| PXI Thermocouple Module |
| PXI DSA Module |
| PXI LVDT Module |
| PXI High-Speed Bridge Module |
| PXI Voltage Input Module |

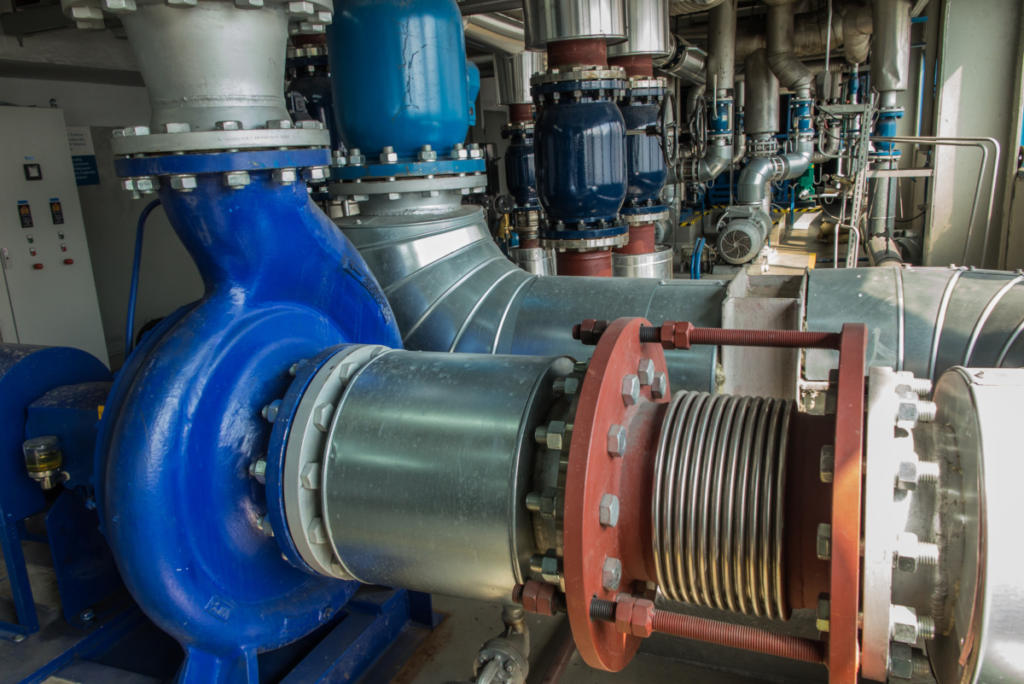
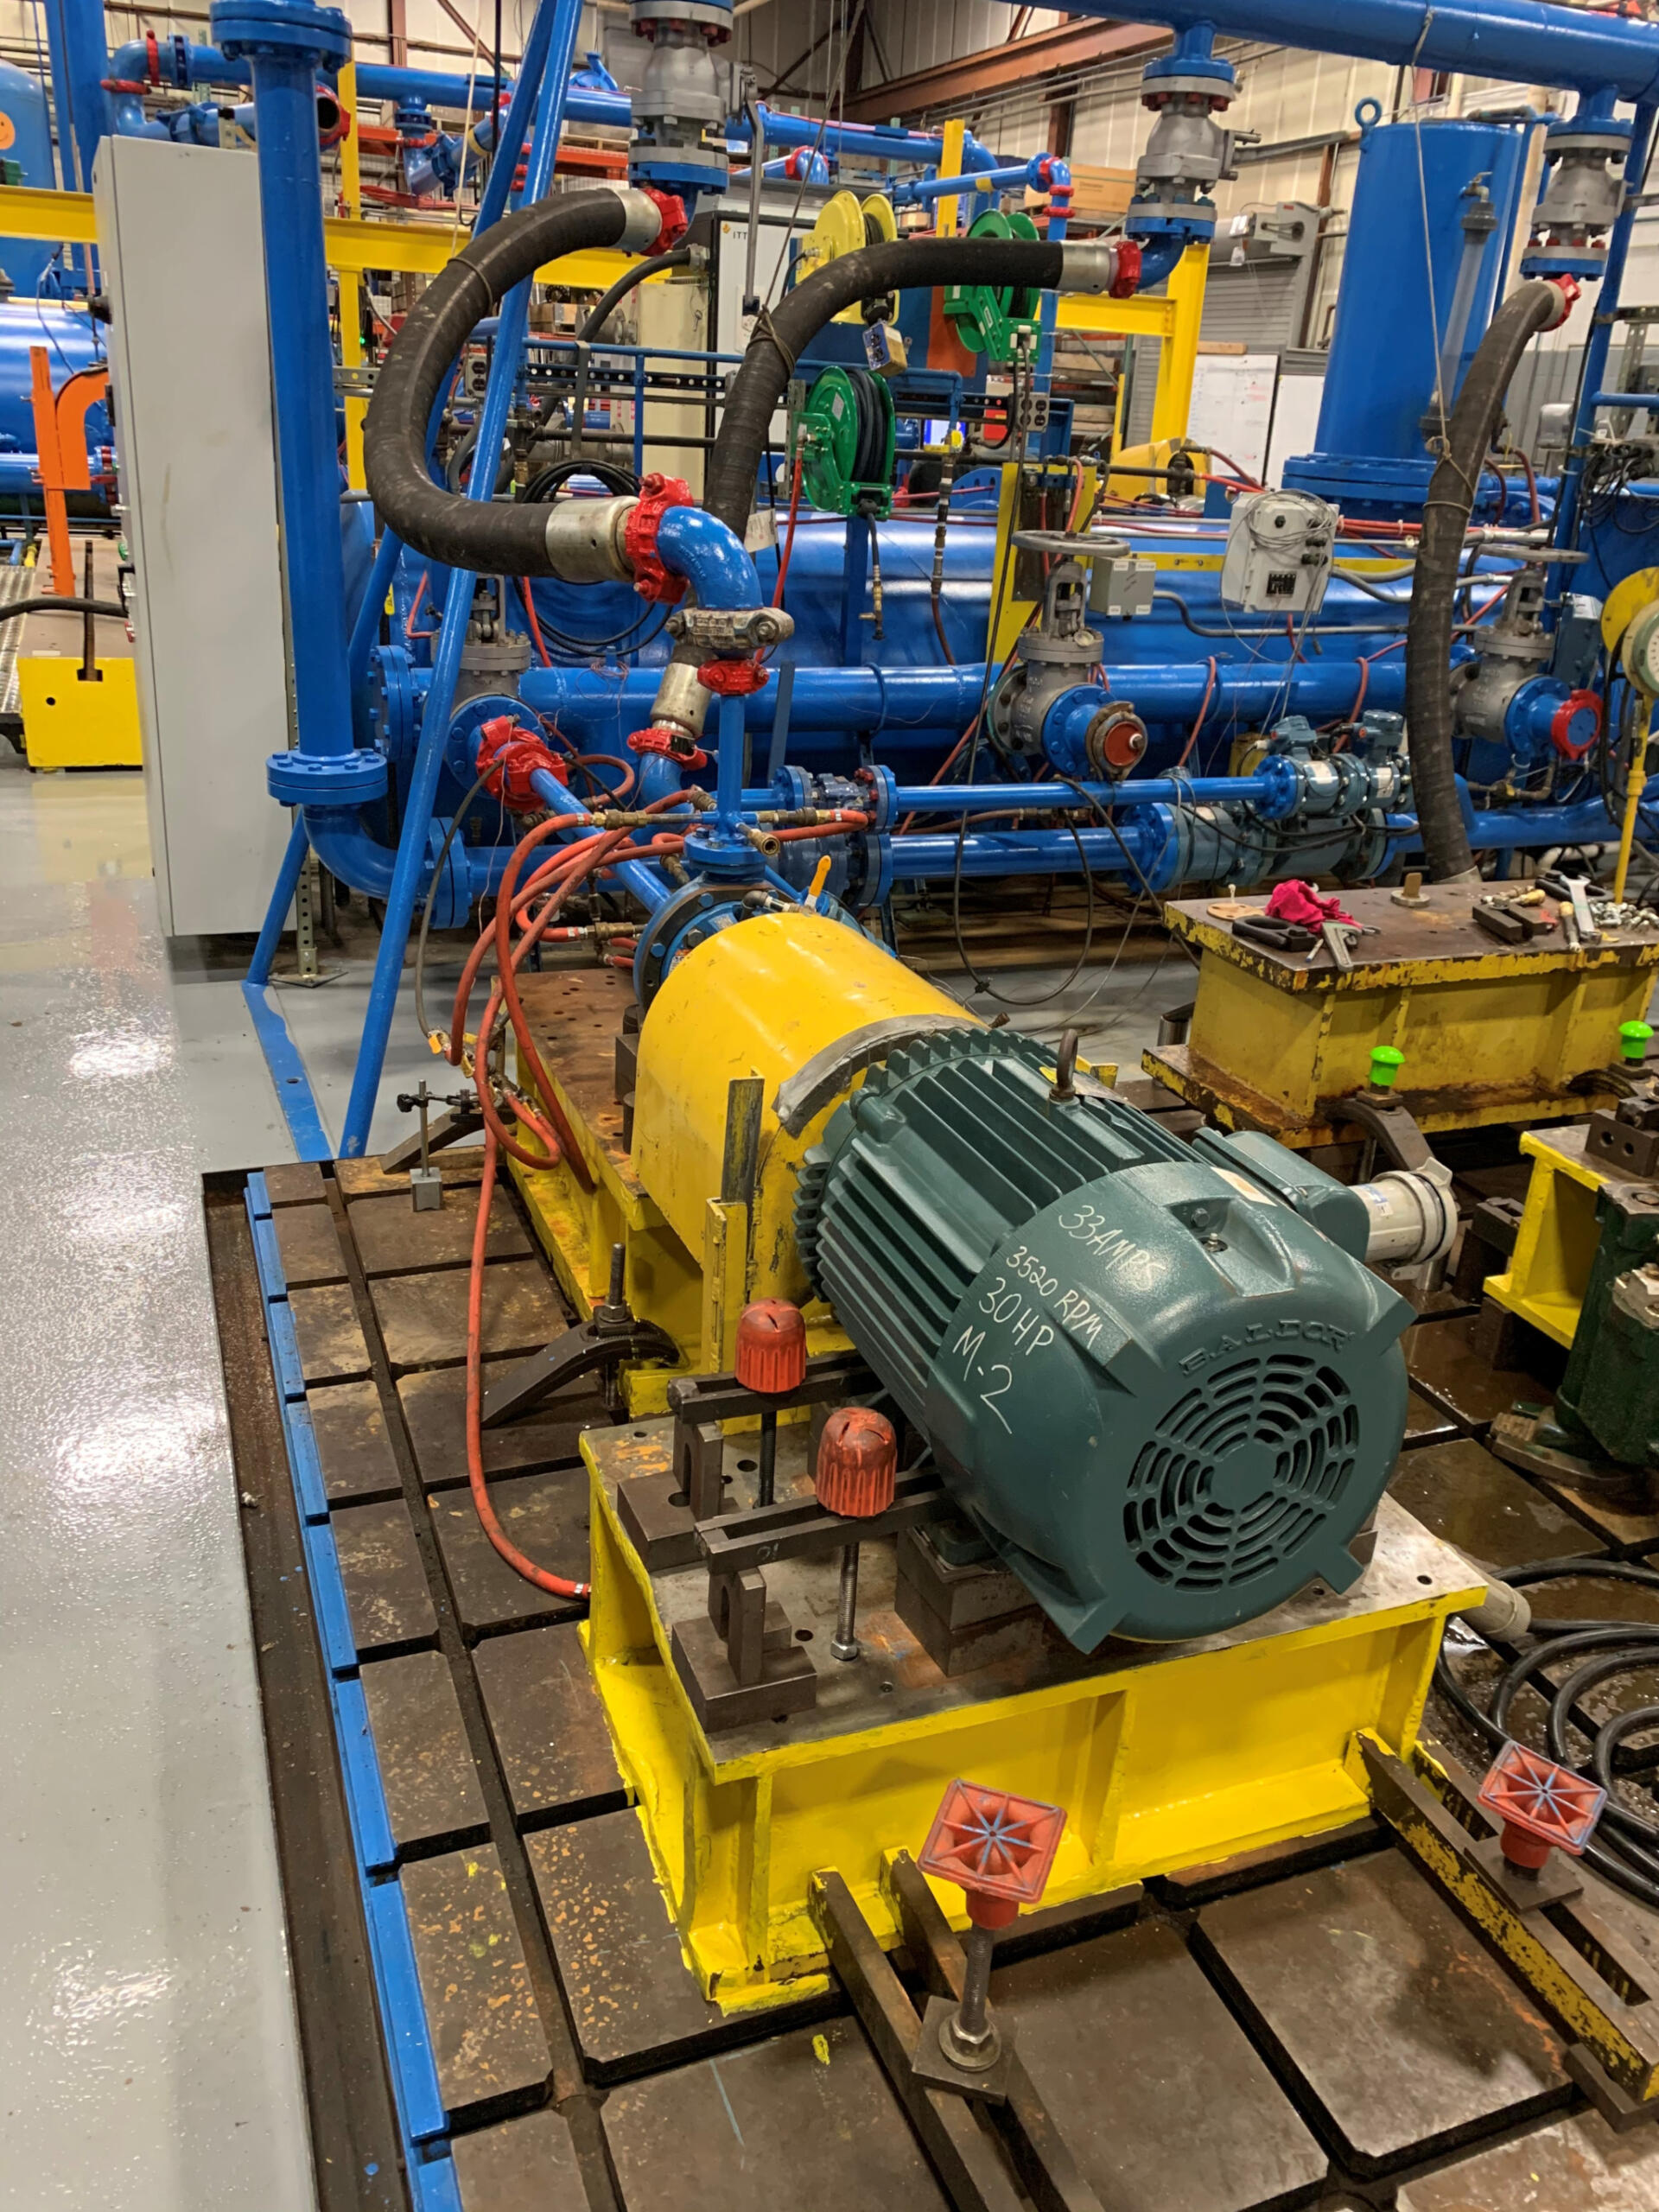
Pump Test Station – Increasing throughput
Pump Test Station – Increasing throughput
Standardizing on testing technique & reporting
Increasing test throughput with automation
Client – Industrial pump manufacturer
Challenge
Pump manufacturers typically test their product in the same facility in which the pumps are created. These tests are well defined and based on standards created by organizations such as API and ANSI to name a few. These tests are run to verify the performance of the pump as well as provide a report to the customer demonstrating that the pump they purchased will meet their needs. Sometimes these tests become factory witness tests where the customer sits in on the testing being performed on the pumps they had purchased.
This particular pump manufacturer had a test facility where many different sizes and types of pumps could be tested. The software provided to them by another integrator to run the test stand had the desired user interface screens, but did not function as requested, and was missing certain desired features.
Our client came to us with the following requests:
- Evaluate the software written by the previous integrator to assess whether any of the code could be reused in the new application.
- Ensure that existing cDAQ hardware would be compatible with changes and improvements to the software.
- Deploy the hardware/software solution on the test site to verify it performed as required.
Solution
The Pump Test Utility was used for end-of-line test and product validation.
It had the following features:
- A Pump Test application that can run one of the following tests at a time:
- Performance Test.
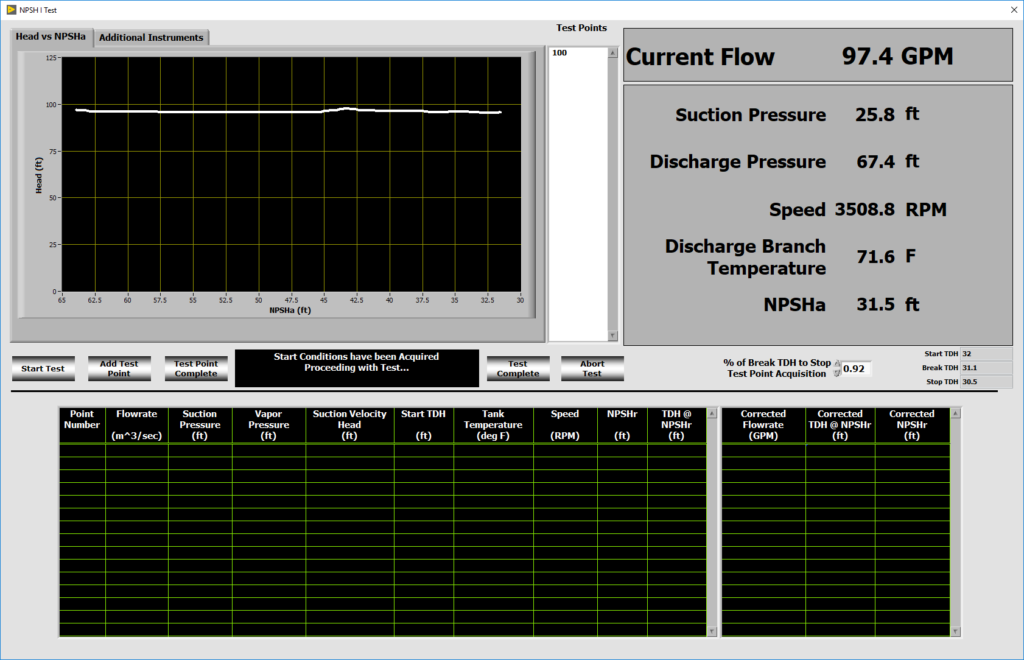
- Net Positive Suction Head (NPSH) Test.
- Mechanical Test.
- All test configuration and data files generated by the software must be compatible with Microsoft Excel.
- Ability to show vibration data real time while the test is running.
Benefits
- Standardization of testing technique –each pump will be tested with the same procedures and calculations/algorithms.
- Automated generation of report content and presentation – automation of this step will save hours of manually recording data and entering that data into a spreadsheet to generate the same report.
- Automation of the reporting and elimination of the need to manually record data will increase throughput of the testing facility.
System Overview
We developed the Pump Test Utility application to allow our client’s engineers and operators to:
- Run one of three guided tests that visually provides pump performance feedback during the test.
- Create a test configuration user interface that will be used to store configuration information that can be recalled when testing a similar pump.
- Automate the collection of data during the test.
- Automate the population of report templates with the configuration and data acquired during the test.
- View and print out vibration graphs real time during the test.
The pump test software was developed in LabVIEW.
It interfaced with simple delimited text files and Excel workbook templates to save the configuration information necessary to set up and run the required tests.
The resulting data acquired during the test, both raw data acquired from the sensors and calculated data used to characterize the pump being tested, are saved to delimited text files.
Both high-speed (10 kS/s) and low-speed (10 S/s) data are acquired. High-speed data are graphed real time in a separate UI that allows the user to set cursors on the graph for visualization and printing to a pdf report.
Low-speed data is written to a delimited text file for archival storage and retrieval if additional analysis is required.
The high-speed data are for vibration measurements. The low-speed data are for pressure, temperature, RPM and flowrate measurements.
Flow rate and vacuum pressure were automatically adjusted using a PID loop and 4-20 mA controlled valves.
The pump test configuration is performed within the application from a series of drop-down selections populated with sensors found in an Excel workbook. The Excel workbook is updated and maintained outside the application. Once the test sensors and conditions have been selected, those selections are written to an Excel workbook for use in the reports.
The Excel ActiveX interface was used to develop the reports the client provided to their customers for the slow data. The Excel workbook template contained the formatting necessary for the reports. As the software wrote the data into the workbook, the reports were built from the formulas and formatting already configured in the Excel template.
At the end of the test, the software printed the appropriate worksheets containing the elements of the report required. The vibration (high-speed data) is written to a binary file and a pdf.
| SOFTWARE FUNCTIONS |
|---|
| Data Acquisition |
| Test Sequencing |
| 3 Standardized Test Types |
| Generate Standard Table-Based Reports |
| Generate Pump Performance Graphs |
| Generate Vibration Graphs |
| Sensor Management Tools |
| Test Configuration Management Tools |
| HARDWARE USED |
|---|
| NI cDAQ Signal Conditioning Chassis |
| Variety of NI cSeries Signal Conditioning Modules |
| Pressure Sensors |
| Level Sensors |
| Flowmeters |
| Vibration Sensors |
| Displacement Sensors |
| Temperature Sensors |
| Torque Sensors |
| Speed Sensors |
Pump Test Station
Pump Test Station
Client – Industrial pump manufacturer
Standardizing on testing technique & reporting
Reducing the number of pumps in the production queue
Challenge
Pump manufacturers typically test their product in the same facility in which the pumps are created. These tests are well defined and based on standards created by organizations such as API and ANSI to name a few. These tests are run to verify the performance of the pump as well as provide a report to the customer demonstrating that the pump they purchased will meet their needs. Sometimes these tests become factory witness tests where the customer sits in on the testing being performed on the pumps they had purchased.
Most pump manufacturers have more than one testing site at a facility to accommodate different pump types and sizes. The ability to automate these tests and to present a common look to the testing process and reports make the customer experience more positive to those reading the reports and/or witness the testing.
Our client came to us with the following requests:
- Evaluate the software written by the previous integrator to assess whether any of the code could be reused in the new application.
- Specify a hardware and software solution to acquire the signals needed to compute the performance results for standard tests. We made recommendations and selected appropriate hardware based on comments from our client about desiring compatibility between their test stands around the world.
- Deploy the hardware/software solution on the first test site to verify it performs as required and then deploy to the remaining test sites at their facility.
Solution
The Pump Test Utility had the following features:
- A Pump Test application that can run one of two different tests; a performance test and a net positive suction head (NPSH) test.
- An Access database was used to store the available sensors for that test site. The user selected the appropriate sensors while configuring the test.
- The test data was stored in an Excel file where each pump received its own Excel file.
- The LabVIEW Report Generation toolkit was used to populate the Excel file with data as well as create the report for the pump
Benefits
- Standardization of testing technique – now each pump will be tested with the same procedures and calculations/algorithms used are standardized across all test sites within the facility.
- Standardization of report content and presentation – now every customer that purchases a pump from our client will receive a report with identical information presented and that information will have been derived from the same calculations/algorithms.
- Reduction of the number of pumps in the production queue (and hence inventory) by roughly as much as 1/2 due to faster data acquisition and especially the archiving of the test results and the generation of the final report and its associated calculations.
System Overview
We developed the Pump Test Utility application to allow our client’s engineers and operators to:
- Run one of two guided tests that visually provides pump performance feedback during the test.
- Create a test configuration file based on an Excel template that will be used to store test data as well as generate a report.
The pump test software was developed in LabVIEW and interfaced with an Access database and Excel workbook to acquire the configuration information necessary to set up and run the required tests. The resulting data acquired during the test, both raw data acquired from the sensors and calculated data used to characterize the pump being tested, are saved to the Excel workbook. Both high speed (10 kS/s) and low speed (10 S/s) data are acquired and stored into one data file for archival storage and retrieval if additional analysis is required. The high-speed data are for vibration and sound measurements and low speed data are for pressure, temperature, RPM and flowrate measurements.
The pump test configuration is performed within the application from a series of drop down selections populated with sensors found in an Access database. The database is updated and maintained by the client through a series of user interfaces within the application. Once the test sensors and conditions have been selected, those selections are written to the Excel workbook for use in the reports.
The LabVIEW Report Generation Toolkit software was used to develop the reports the client provided to their customers. The Excel workbook template contained the formatting necessary for the reports. As the software wrote the data into the workbook, the reports were built from the formulas and formatting already configured in the Excel template. At the end of the test, the software printed the appropriate worksheets containing the elements of the report required.
| SOFTWARE FUNCTIONS |
|---|
| Data Acquisition |
| Test Sequencing |
| Metric or SAE Units |
| Multi-Level User Authentication |
| 2 Standardized Test Types |
| Generate Standard Table-Based Reports |
| Generate Pump Performance Graphs |
| Generate Vibration Graphs |
| Sensor Management Tools |
| Test Configuration Management Tools |
| HARDWARE USED |
|---|
| NI cDAQ Signal Conditioning Chassis |
| Variety of NI cSeries Signal Conditioning Modules |
| Pressure Sensors |
| Flowmeters |
| Vibration Sensors |
| Displacement Sensors |
| Temperature Sensors |
| Torque Sensors |
| Speed Sensors |
Pump Test Station Used Across Multiple Locations Worldwide
Pump Test Station Used Across Multiple Locations Worldwide

Client – ITT Goulds Pumps
Challenge
Pumps are used for everything from sump pumps for the consumer home market all the way to large pumps for industry capable of moving thousands of gallons per minute. Just as varied is the fluid being pumped: from water to slurries to hydrocarbon-based fluids.
Pump manufacturers typically build and test in plants across the world and each of those facilities is responsible for testing every pump manufactured at that site to ensure that the pump will perform as the customer expects. These tests are well defined and based on standards such as API, ANSI and other organizations. These standards provide test procedures but do not give details as to how to perform the tests. Each site typically tests their product without guidance as to how to satisfy the aforementioned standards. As a result, differing hardware and software solutions are usually put in place to test the individual site’s products.
Such varied testing systems make it exceedingly difficult to compare test results across testing sites, both within plants and between plants.
We were asked by our client to create a homogeneous test platform with which they could compare data across manufacturing plants and test sites within the plants as well as automate calculations of plant performance metrics and reporting.
This client engaged us to develop and implement a software and information storage solution that could run the prescribed tests on any testing site and make these data available to their engineers. These tests were to be semi-automated and guide the test operator through a test ensuring that the procedure and the resulting data were collected in the same manner on every test site, worldwide.
Solution
The Pump Test Globalization application consists of the following sub-applications:
- A Pump Test application that can run 1 of five different tests simultaneously to reduce the amount of time the UUT is under test. A separate data file is generated for each test and those data files are stored in the database along with the test results.
- A Test Configuration application that helps to manage the orders and the tests association with those orders.
- A Report Generation application that creates a report for each test run on a pump. Additional performance graphs are generated along with options for graphs depicting vibration and orbital performance of the pump.
Benefits
- Standardization of testing technique – now each pump will be tested with the same procedures and calculations/algorithms used are standardized across all manufacturing test sites.
- Standardization of report content and presentation – now every customer that purchases a pump from our client, regardless of origin of manufacture, will receive a report with identical information presented and that information will have been derived from the same calculations/algorithms.
- Ability to generate manufacturing performance data – metrics such as first pass yield may be calculated for all manufacturing sites. Data from all manufacturing sites may now be compared.
- Abstraction of data acquisition hardware – measurement data can be acquired from a variety of sources including OPC servers and NI DAQ Hardware. With this abstraction, the client’s existing hardware was reused where it made sense and replaced with new hardware as needed.
System Overview
We developed Pump Test, Pump Test Configurator and Pump Test Report Generator applications to allow our client’s engineers and operators to:
- Run one or a series of guided tests that visually provides pump performance feedback during the test.
- Configure a test for a specific pump model number and serial number. This configuration is read in by the Pump Test software to set up the test according to the configuration.
- Generate a report that would be sent with the pump to their customer showing how the pump performed and that it met the customer’s requirements.
The pump test software was developed in LabVIEW and interfaced with a SQL database to acquire the configuration information necessary to set up and run the required tests. The resulting data acquired during the test, both raw data acquired from the sensors and calculated data used to characterize the pump being tested, are saved to the database. Both high speed (10 kS/s) and low speed (10 S/s) data are acquired simultaneously and stored into one data file for archival storage and retrieval if additional analysis is required. The high-speed data are for vibration and orbital measurements and low speed data are for pressure, temperature, rpm and flowrate type measurements.
The pump test configuration software was also developed in LabVIEW and is a separate application that uses a SQL database on the back end. The database is located on a secure server and has been designed to retain the following information:
- Lists of all the manufacturing and test facilities.
- List for all the motors used for running the pumps.
- List for all the available sensors and hardware for each test station for every manufacturing plant.
- Ability to associate each sensor with a hardware channel for acquisition.
- Create and edit orders that contain pump specific information such as model number and serial number.
- Create and edit test configuration information for a given order.
The report generation software was also developed in LabVIEW and provides the user a means to create standard reports for each of the test types. Additional addendums to the standard report can be created to include graphs utilizing the high-speed data such as vibration and orbital information.
| SOFTWARE FUNCTIONS |
|---|
| Data Acquisition |
| Test Sequencing |
| Test Configuration Verification |
| Language Localization |
| Metric or SAE Units |
| Multi-Level User Authentication |
| 5 Standardized Test Types |
| Generate Standard Table-Based Reports |
| Generate Pump Performance Graphs |
| Generate Vibration and Orbital Graphs |
| Pump Order Management Tools |
| Sensor Management Tools |
| Test Configuration Management Tools |
| HARDWARE USED |
|---|
| NI cDAQ Signal Conditioning Chassis |
| Variety of NI cSeries Signal Conditioning Modules |
| Various OPC Servers for PLC Communications |
| Pressure Sensors |
| Flowmeters |
| Vibration Sensors |
| Displacement Sensors |
| Temperature Sensors |
| Torque Sensors |
| Speed Sensors |
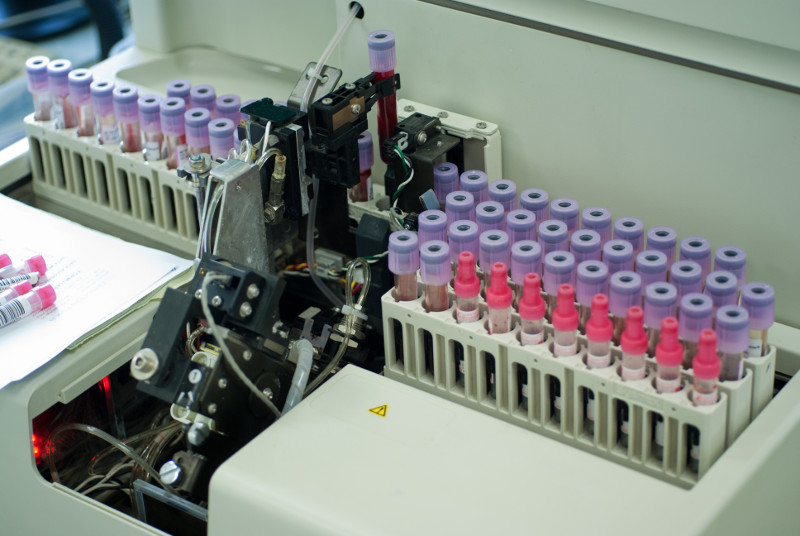
Automated Manufacturing Test Systems for Medical Diagnostic Equipment
Automated Manufacturing Test Stands for Medical Diagnostic Equipment
Using NI PXI and LabVIEW as a common architecture for multiple test systems testing several subassemblies
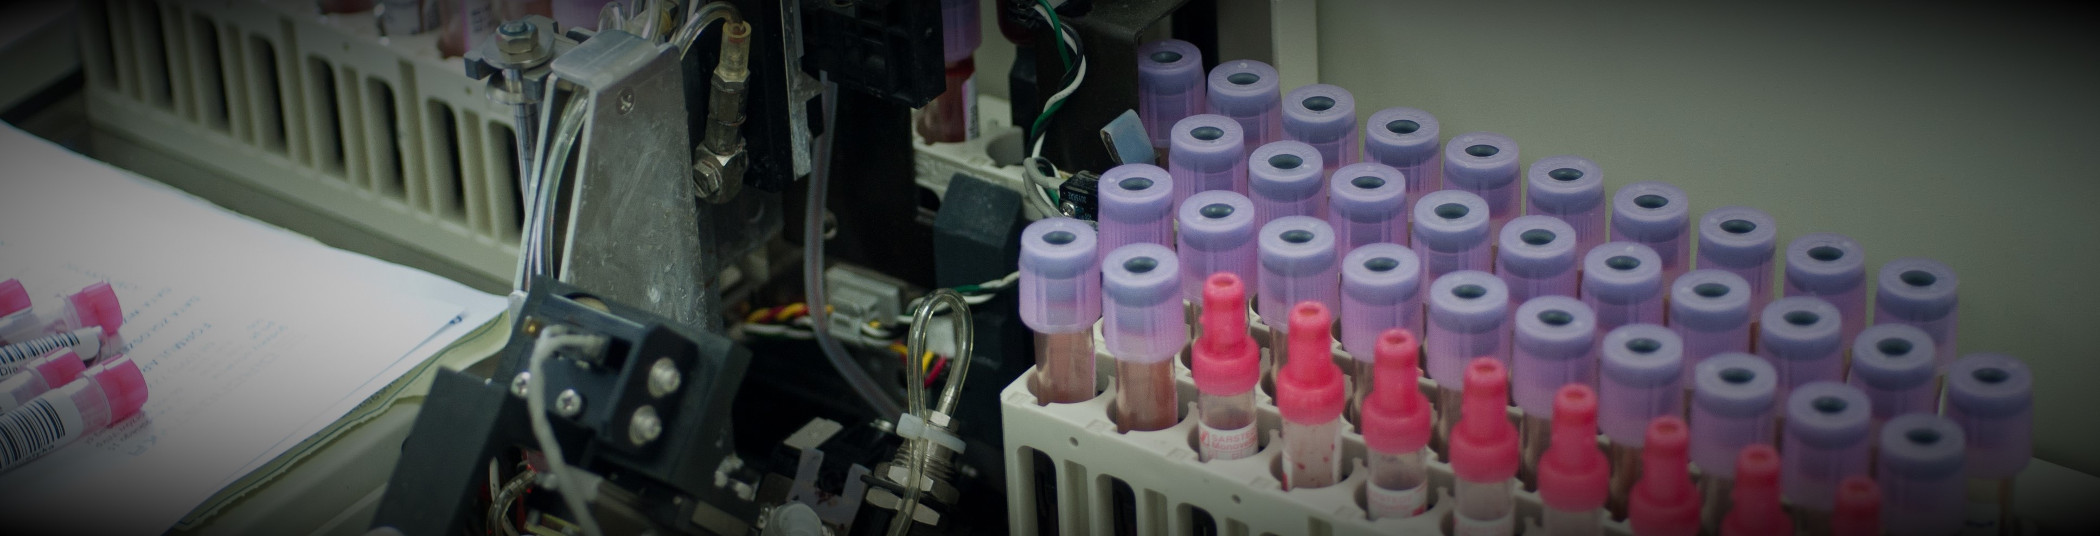
Client: a manufacturer of automated blood analysis machines
Challenge
Our client was embarking on a complete redesign of their flagship automated in-vitro Class 1 blood diagnostic machine. In order to meet schedule goals, the design and build of several automated test systems needed to occur in parallel with the overall machine. In a major design paradigm shift, many components of the machine were being manufactured as modular subassemblies, every one of which was an electro-mechanical device. Thus, multiple testers were required to test each of the specific subassemblies in the machine. And, since this was a medical device, the testers needed to comply to 21 CFR Part 820 and Part 11.
Solution
With a looming deadline, the testers needed a common architecture, so that all testers could leverage the development from the others. Since each subassembly could be tested independently of the overall machine prior to final assembly, the design of the testers was based on a common measurement and reporting architecture, written in LabVIEW, that interfaced to the customers Part 11 compliant database for testing procedures and measurement results. Furthermore, procedures and validation checks for calibration of the testers were part of the overall test architecture.
Benefits
- Modularization of the test system architecture aided development and maintenance
- Reduced overall development costs due to standardization of test sequence steps and reporting
- Both test sequences and test results were stored in a managed database that satisfied 21 CFR Part 11 requirements
- Modular and common software developed for the test systems reduced the V&V effort during IQ & OQ.
System Overview
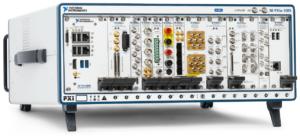
Since multiple subassemblies were being tested, with one part-specific test system per part, the automated test systems used as much common hardware as possible to simplify the development effort through common hardware drivers and test steps. Test steps and the test executive that executed the test sequence(s) were developed using LabVIEW. Measurements were made with PXI equipment housed in a test stand along with support hardware.
The types of test steps required to verify the proper operation of each subassembly were categorized into basic operations, such as voltage reading, pulse counting, temperature reading, and communications with on-board microcontrollers. The specifics of each measurement could be configured for each of these measurement types so that each test step accommodated the needs of the specifics of each subassembly. For example, one subassembly might have needed to run the pulse counting for 2 seconds to accumulate enough pulses for accurate RPM calculation while another subassembly might have only needed 0.5 seconds to accomplish that calculation.
The configuration of a test step algorithm was accomplished via an XML description. The accumulation of these XML descriptions of each test step defined the test sequence run on that specific subassembly.
Test results were associated with these test sequences by completing the entries initially left blank in the test sequence, so that all results were explicitly bound to the test sequence.
The operator user interface distinguished between released and unreleased test sequences. With unreleased test sequences, engineers could try the most recent subassembly designs without needing to wait for final validation. The released sequences were only available to test operators. This login-driven branching was managed using the Windows login, so that the client employees could use their company badge-driven login process. Once logged in, the user would be able to execute the test sequence in automated mode, where all steps happen automatically, or manual mode, where one step could be operated at a time.
Furthermore, the Windows environment was locked down using built-in user account group policies to designate the level at which a user could access Windows or be locked into accessing only the test application.
V&V Effort
During the V&V effort, each test sequence was verified for expected operation, against both known good and bad parts. Once verified, the sequence was validated against the requirements and, when assured to be as expected, a checksum was applied to the resulting XML test sequence file and all was saved in a Part 11 compliant database. Upon retrieval, when ready to run a test, the sequence was checked against this checksum to assure that a sequence had not been tampered.
Test results, saved as XML in the same file format as the test sequence, were also surrounded by a checksum to verify that no tampering had occurred.
The IQ/OQ efforts were handled in a traditional manner with the client developing the IQ/OQ documentation, with our assistance, and then executing these procedures, again with our assistance.
| SOFTWARE FUNCTIONS |
|---|
| Low-level measurement drivers |
| Measurement-based test steps |
| Test sequence execution |
| Test sequence management |
| User access management |
| Test report creation and management |
| Verification of test sequence content and ability of user to execute |
| Verification of the content of the test results |
| HARDWARE USED |
|---|
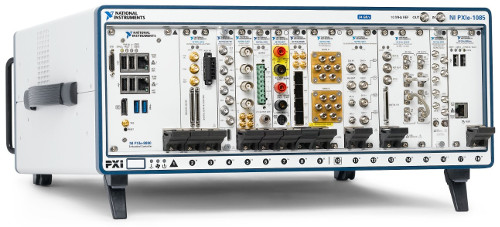
| PXI chassis and controller |
| PXI acquisition cards for analog measurements |
| PXI acquisition cards for digital input and output |
| CAN card |
| INTERFACES / PROTOCOLS |
|---|
| Ethernet |
| CAN |
*- images are conceptual, not actual
Endurance and Environmental automated test system for electro-mechanical sub-system
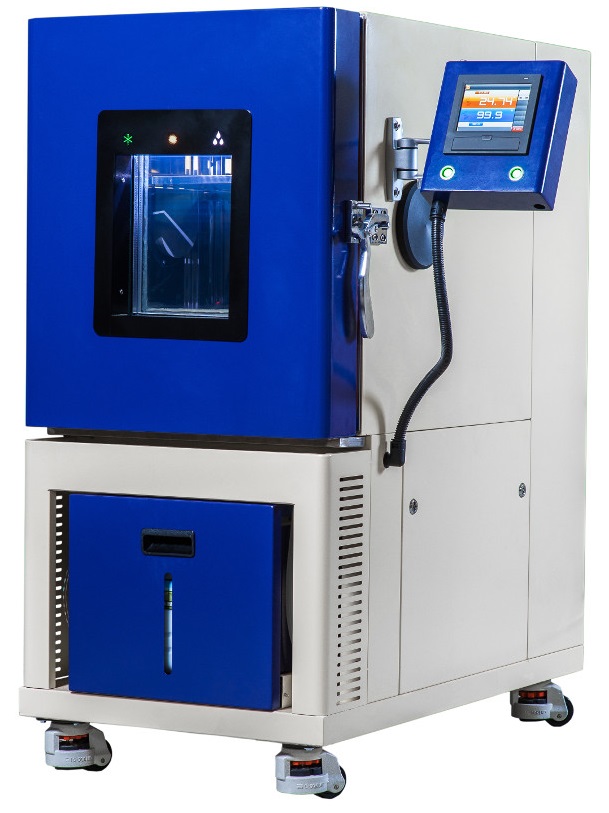
(image is representative, not actual)
Endurance and Environmental automated test system for electro-mechanical sub-system
Automating tests that run for weeks at a time
Client – Automotive component supplier
Challenge
Our client was already doing validation, but it was manual, and the client’s customer started requesting faster turnaround of results. Their customer was also requesting data to be sent with the results. Our client chose to automate the validation process to enhance their productivity.
Solution
Viewpoint utilized the (mostly) existing hardware from the manual tester and developed software to automate the testing. The LabVIEW-based automated test system allows for endurance & environmental validation testing of an electro-mechanical sub-system.
Benefits
- Automates tests that run for weeks at a time
- Logs errors during the test (e.g., for continuous monitoring tests, logging the number of instances of when a UUT’s LIN (Local Interconnect Network) response deviates from a static, current draw outside of limits)
- Capable of testing a large variety of product lines
- Logs pertinent data to a database for post-test analysis/inclusion into reports
System Overview
The UUT is an electro-mechanical part that falls under a variety of different product lines. As such, the client had a couple variants of the tester, based on the communication needs of the UUT. A total of more than a dozen testers were deployed. The functionality of the tester evolved over time, specifically modifying software to make the tests faster / decrease cycle time.
| SOFTWARE FUNCTIONS |
|---|
| Extensive diagnostic/manual operation of system for debug of software and electrical connections between the UUT and the test stand/tooling. |
| Product-specific software components to operate unique products. |
| Execute mechanical endurance tests. |
| Execute environmental endurance tests. |
| Database output containing results from every test cycle (either mechanical cycles or time depending on test being run). |
| HARDWARE USED |
|---|
| USB-LIN module |
| USB and PCI CAN Interfaces |
| Analog input card |
| Digital Input card |
| Digital Output card |
| Power Supplies |
| DMMs |
| Switch Matrix |
| INTERFACES / PROTOCOLS |
|---|
| CAN |
| LIN |
| USB |
| GPIB |
Endurance Testing using NI PXI
Endurance Testing using NI PXI
An automation test stand permits faster validation, unattended test, an increase in throughput, and can free up resources for other tasks during the weeks long endurance test.
Client – A manufacturer of aircraft components in the mil-aero industry
Challenge
New product development drove the need for a new aerospace endurance test stand for product validation. The old systems were not designed to test the newly designed part (aircraft actuators), and the company didn’t have the time or resources to reconfigure existing systems to perform the testing required.
Solution
The new PXI-based endurance test stand provides automated electromechanical testing, full data recording, report generation and a diagnostic panel for intelligent debug. Viewpoint selected the NI equipment while the test stands and other components were selected and fabricated by the customer.
Benefits
- This automated aerospace test stand permits faster validation, unattended test, an increase in throughput, and can free up resources for other tasks during the weeks long endurance test.
- Full data recording with a data viewer enables post analysis, which provides the ability to review and analyze raw signals captured during execution. Channel examples are actuator LVDT position, load, current, and encoder actuator position.
- Summary report capability allows the customer to document the amount of testing completed against the full endurance test schedules.
- A manual diagnostic operational panel provides the ability to verify particular DUT functionality or components without running an entire schedule.
- Systems can be paused and restarted to allow for “scheduled maintenance” of the DUT such as inspections, lubrication, etc.
System Overview
The PXI-based aerospace endurance test stand enables data collection, deterministic PID Loop Control, emergency shutdown and a diagnostic panel for manual test and debug operation. The system runs endurance test schedules, that are defined as a recipe for test execution. These schedules, which are customer-defined and DUT-specific, are designed to simulate the actual conditions the DUT would see in real world application as closely as possible. LabVIEW-RT was used for the deterministic looping for Closed Loop Control of Actuator Position and Load Control. LVDT demodulation was performed on a PXI FPGA card programmed with LabVIEW FPGA.
| SOFTWARE FUNCTIONS |
|---|
| GUI |
| Summary Reports |
| Full Data Collection for Real-Time and Post Analysis |
| Deterministic PID Loop Control |
| E-Stop Management |
| Diagnostics Panel for Manual Test and Debug |
| Endurance Test Schedule Execution |
| Hydraulic Control Panel for Source & Load PSI Control |
| HARDWARE USED |
|---|
| Test stand for PXI hardware and cable connectors |
| PXI |
| Various PXI-based data acquisition cards |
| PXI RT controller |
| PXI FPGA card |
| INTERFACES / PROTOCOLS |
|---|
| TCP/IP |
Product Validation using LabVIEW RT & LabVIEW FPGA – Electromechanical Actuator Test Stand
Product Validation using LabVIEW RT & LabVIEW FPGA – An electromechanical test stand for an aerospace actuator
Automated testing reduces operator man hours and increases production throughput.
Client – A manufacturer of actuators in the mil-aero industry.
Challenge
New Product Introduction (in this case a new controller and new actuators) drove the need for a new aerospace electromechanical test stand.
Solution
New NI PXI-based electromechanical test equipment provided automated HIL testing, report generation, and SPC data generation. The sequencing of the test procedure, reporting, and verifiable results were managed with the StepWise test executive platform.

Benefits
- Automated testing reduces operator man hours and increases production throughput.
- Meets strict customer requirements regarding testing and data recording in a verifiable manner.
- Automated Test Report Generation.
- Collects data to support SPC (Statistical Process Control).
- Ability to interact with the internal state of the controller FPGA via the LVDS communication link.
System Overview
Viewpoint developed the software and selected NI data acquisition and control hardware for the test stand. There are several layers of software functionality. Also, the modularity of the test stand hardware assures maintainability for future upgrades and reduction of potential obsolescence issues, especially since the “programmability” of the FPGA-based HW allows repurposing via LabVIEW FPGA.
| HOST LABVIEW SOFTWARE LAYER |
|---|
| Test sequencer |
| Test steps (e.g. Frequency Response, Step Response, Dynamic Stiffness, Fault Response, Power Consumption) |
| Test Report Generator |
| GUI |
| REAL-TIME (RT) LABVIEW SOFTWARE LAYER |
|---|
| Data acquisition |
| 1553 comms |
| Function generator |
| Error detection |
| ESTOP |
| LABVIEW FPGA SOFTWARE LAYER |
|---|
| Synch data from 3 sources (tester, UUT, external DAQ device) |
| Stream high-speed data to disk |
| Stream high-speed data to analog outputs for HIL test |
| Custom communication protocol used by UUT over LVDS lines |
| HARDWARE RECOMMENDED |
|---|
| NI PXIe |
| NI FlexRIO card with LVDS adapter module |
| Multiple NI R Series cards |
| High speed, high voltage, isolated analog input cards |
| INTERFACES / PROTOCOLS |
|---|
| MIL-STD 1553 bus |
| LVDS |
| Ethernet |
| Custom TCP/IP |
*- images are conceptual only, not actual
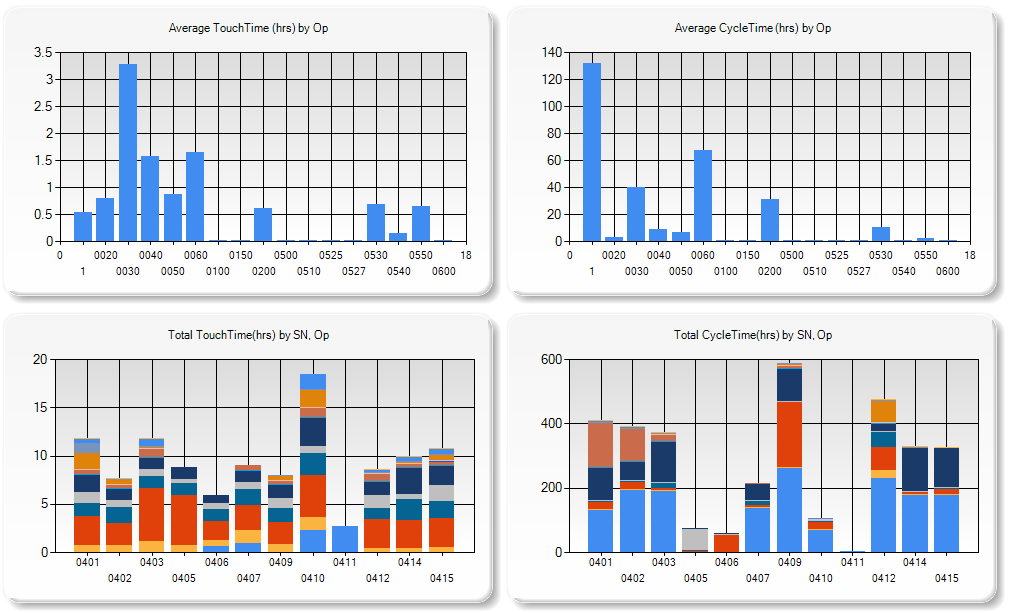
Hidden Factory Assessments Lead to Waste and Cost Reductions

Sharing Business and Test Data Enables Efficiency Improvements
Reduce Production Costs by Coordinating Business and Test Data
Client: A major manufacturer of aerospace components
Problem Scope
Many companies operate in a high-mix, low-volume manufacturing environment. In these situations, production of such parts is often complex, with long assembly and test procedures describing the process to make and verify the part. Discussions of automating any part of these processes are often dismissed because an automated test system is thought to be expensive, especially an aerospace test system which requires significant documentation and acceptance testing efforts. Plus, it’s often erroneously thought that each part needs a unique test system.
Challenge
Our client wanted to improve their capability to manage the assembly procedures and get clarity on the status of any parts, whether partially or fully assembled. The existing situation had data manually-entered into a database form or even handwritten data that needed to be transcribed into a database. Often the database was local to the assembly cell. The chance for error was significant and the lag between data collection and updating the database was often days. When questions arose about the status of a particular unit, many hours could be spent in locating and evaluating the associated forms and paperwork.
The steps needed to achieve these goals were clear: automate the collection data on each part while being assembled so that those results would appear in a business-level database which would give a plant-wide view of the status of all the parts in progress.
Thus, this project needed to allow read/write access to sections of the Manufacturing Enterprise System (MES) database so that information about a part being assembled could be obtained automatically and results could be submitted to that MES database automatically.
Solution
We designed the PXI-based system based on the StepWise test executive platform to automate the assembly and testing. This platform enables two significant changes. These changes were made at each assembly cell by having the operator use a test PC and perhaps some measurement equipment as appropriate for the part(s) being assembled at that cell.
First, we replaced all the printed assembly procedures with electronic records so that any operator could review the latest version of the work instructions on a computer screen. This approach helped with version control, especially important since the client had various model revisions that came through the factor for rework, each with slightly different versions of assembly instructions.
Second, we displayed those electronically documented work procedures as steps in a test executive, allowing the results of each step in the assembly procedure to be captured electronically. When an assembly step was purely manual with no measurements, the fact that step was completed would be recorded, along with information such as the name of the operator performing the step, the duration that the step took, and so on. When a step required a measurement to be made, such as a functionality verification or a calibration result, the measurement would be collected. If the equipment making that measurement could be automated, we would collect that data automatically, and not require the operator to type the result into a computer form.
The outcome of this effort has enabled the client to get a snapshot of the status of parts in assembly, i.e., Works in Progress (WIP), quickly and accurately.
After these changes were made, many additional capabilities are now available with the advent of purpose-built queries into the appropriate MES database tables. The table below shows the overall efficiency gains achieved.
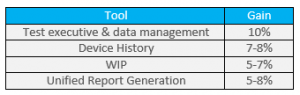
The key is the combination of the electronic test results obtained at the test equipment with information on work orders and manufacturing flow held in the various tables in the business MES database. This improvement happens even with manual or semi-automated test systems, and does not require a completely automated assembly and test system. Thus, the cost of the test system is much less than usually expected and, hence, the benefits are more easily cost-justified.
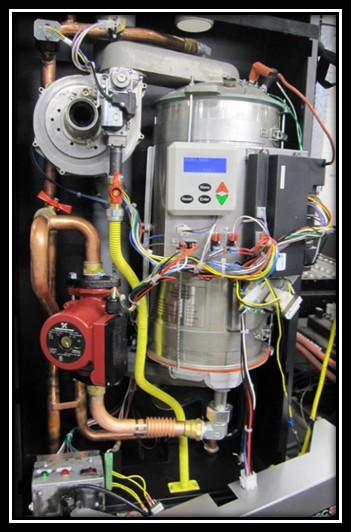
Automated End-Of-Line Tester Upgrade – Boiler

Automated End-Of-Line Tester Upgrade – Boiler
Automated End-Of-Line Tester upgrade makes operators and engineers happy
Client – ECR International: A manufacturer of heating and cooling systems.
Challenge
ECR has significant domain expertise in developing boiler systems. Viewpoint has significant domain expertise in measurement and control systems. To ensure quality control ECR International utilizes an end-of-line testing stand. Each boiler is test fired and adjustments are made to optimize proper combustion. Results of the testing are recorded along with the boiler’s unique serial number.
The team at ECR needed an upgrade to one of their end-of-line test systems to support an increase in production capacity without sacrificing the testing and quality assurances process.
ECR also wanted to eliminate the need to constantly adjust test limits based on temperature. This manual adjustment process was time consuming.
They took this as an opportunity to update and clean up the code base for supportability.
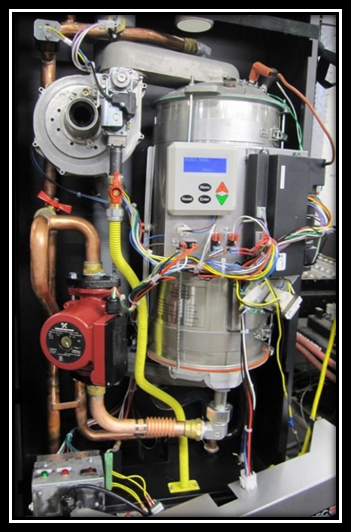
Solution
Viewpoint was asked to upgrade the existing test stand code and add a bit of functionality. Since ECR already had the necessary hardware, Viewpoint worked with the existing hardware set, porting software and adding new features.
The updates improved usability, saved time, and increased accuracy.
The solution was delivered on time and under budget.
Benefits
- Test time reduction and increased accuracy (automated temperature-based test parameter control)
- Increased test flexibility (can test at multiple boiler capacities)
- Improved operability with updated user interface
- Improved development supportability with cleaned up code base
- Improved IT supportability with updated code base
- Increased stability (EEPROM test stand lock-up resolved)
System Overview
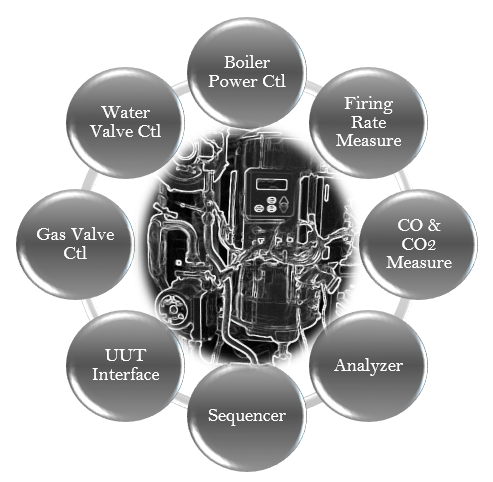
Improving Efficiency in Industrial Manufacturing Test

Improving Efficiency in Industrial Manufacturing
Simplifying Report Generation for High-Mix, Low-Volume Industrial Servo Valve Tests
Client: A major industrial servo valve manufacturer
Challenge
A manufacturer of components for both commercial and military aircraft built a large number of different models of servo valves. Some models were made only a few times each year, while other models were made with an order of magnitude higher volume. Each unit underwent rigorous testing during and after assembly.
Our client needed to submit the results of that testing to their customers but since the production and testing of each unit happened in many locations, possibly even around the world, many hours were spent locating the appropriate datasets and assembling the report.
Furthermore, our client wanted to improve their responsiveness to requests from their customers by having rapid retrieval of the test report for any part after it had been delivered into the field.
Solution
Since the test datasets were varied due to the large numbers of different valve models and associated test procedures, a database was created using a platform based on the Resource Description Framework (RDF). An RDF database can accept arbitrary types of data, manage that data through metadata tags, and adjust gracefully to changes in content and shape of the connections between objects in the database.
This adaptability was key to our client being able to leap past some of the issues in standard SQL-based relational databases.
The results from each test run on each part at each (PXI-based) test system were tagged with metadata and pushed into the RDF database. The StepWise test executive platform interfaced to the RDF database by outputting XML content which was scanned by a routine created for the RDF database and converted into the RDF data and links. The part ID was a critical tag since this allowed searching the RDF database for all results associated with that specific part. This database resided on a server at the client’s headquarters and accepted data from worldwide locations.
Once the data for each part was housed in the database, a report could be generated. To accommodate the variety of data in that report, web technology was used to render the report pages based on the types of data entered into the database, as described by the metadata tags. For example, data identified as waveforms could be plotted or listed in tabular format. Having reports rendered based on the data types made it possible to handle adjustments to the types of data measured by the test system.
Results
With the ability to render reports quickly, our client could produce detailed reports for their customers indicating the performance of any specific requested servo valve.
Our client was able to trim the time to create reports to less than 1 day from the previous effort of 3-5 days and with less error.
- Data are now organized uniformly, simplifying the location of desired information, as compared with files stored on various test PCs and file servers.
- The client has the ability to generate automatic emails to their customers with the required reports already attached and ready to go.
- In potential warranty and customer service situations, having the ability to send the customer a report within hours represented great customer service.
All these features are available consistently across worldwide manufacturing facilities, reducing training and maintenance of procedures. And, of course, the reports handle using metric or English units as appropriate for the end customer.
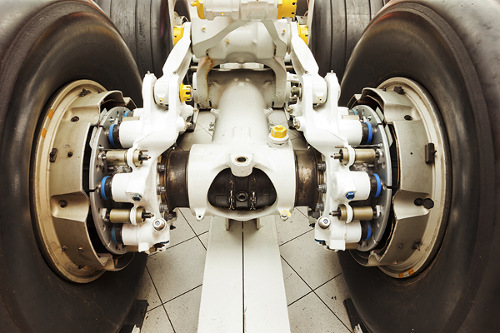
Decreasing Test Time for Aircraft Landing Gear

Decreasing Test Time for Aircraft Landing Gear
Endurance Testing for Aircraft Nose Landing Gear Steering
Client: A major manufacturer of aircraft landing systems
Challenge
A major manufacturer of aircraft landing equipment needed to develop a means of endurance and fatigue testing new designs for aircraft steering. The actuators involved in steering the nose landing gear (NLG) required precise and reliable control through thousands of steering cycles.
Control loops needed to be closed at faster than 1 ms.
Prior systems were handled manually without real-time control and monitoring.
Solution
Our customer designed and built a test rig to provide the hydraulics and environmental conditions for the endurance testing on the NLG. Viewpoint Systems supplied the electronic data acquisition and control hardware coupled with real-time software to provide the required fast control loops. The configuration and execution of the 1000s of steering cycles were managed by the same data acquisition and control system through a set of configuration screens that allowed specification of turn rates, min/max angles, drive and resistive torque settings, and so on. The flexibility offered with this HIL test capability mimicked the variety of conditions that the NLG would encounter in actual use.
- The various PID control loop configurations were also configurable along with gain scheduling required under different operating conditions.
- The environmental conditions were supported by controlling a temperature chamber through ramp and soak settings occurring during the steering tests.
- Measurements on the steering performance were collected from commanded setpoints, sensor readings, and controller outputs during the entire test run.
- Alarm and fault conditions, such as force exceedance, were monitored continuously during operation so that the system could safely run unattended.
Since the deployed solution was an aerospace test system, the entire system underwent an extremely rigorous acceptance testing procedure to verify proper and safe operation.
| SOFTWARE FUNCTIONS |
|---|
| Arbitrary Load and Position Profiles |
| Flight Position Control |
| Load Position/Force Control |
| Endurance/Flight Schedule Execution |
| Deterministic RT for DAQ and PID Control |
| HARDWARE |
|---|
| PXI/SCXI Hybrid RT Chassis |
| Discrete Pump Skid Interface |
| Custom Control Panel/Console |
| INTERFACES |
|---|
| Ethernet TCP/IP |
| SCXI |
Results
Prior to deployment of our system, setup of a test was much more manual and operators needed to be around to monitor operation.
With our new system, complete endurance testing could be specified and executed with minimal supervision. Furthermore, the tight integration of real-time control, HIL testing, and coordinated data collection made report creation much simpler than before.
The rigorous acceptance test gave trustworthiness to the data and allowed the design engineers to validate performance more quickly than the prior semi-automatic and manual methods of operation.
Setup of tests has been improved from prior operations. The endurance testing itself operated over a huge number of cycles lasting weeks to months between scheduled lubrication and maintenance.
The deployed system measures performance during the entire testing, even between the scheduled downtime.
If you need a custom test system for your mission-critical electromechanical component, reach out here.
We’ve helped teams at some of the world’s most innovative companies