LabVIEW Consultants / LabVIEW Programming Services | LabVIEW System Integration
US-based manufacturers: Need a LabVIEW Expert?
Need some existing code updated? Need a whole new LabVIEW-based test system?
While we go by many names (e.g. LabVIEW experts, LabVIEW system integrators, LabVIEW consultants, LabVIEW specialists, LabVIEW programmers, LabVIEW developers), the key takeaway is that we can take the software development and hardware integration off your plate.


Capabilities & Expertise (LabVIEW and NI hardware related)
We have one or more:
Certified LabVIEW Architect
Certified LabVIEW Developer
Certified TestStand Architect
Certified TestStand Developer
Talk to a LabVIEW Consultant. |
|---|
We’ve helped teams at some of the world’s most innovative companies


Testimonials
“Very impressed…kudos to Viewpoint”
I really want to thank you for all your help getting us to this stage in automating our testing. We had our customer in this week to oversee some testing and they were very impressed, which is definitely kudos to Viewpoint.
“Significant value”
The Viewpoint team provides significant value to our projects, and I really enjoy working with Viewpoint.
“Valuable part of our global team”
I have been working with Viewpoint for 15+ years on multiple projects. They have always provided creative and quick solutions to all of the problems we have placed in front of them. I have always considered them a valuable part of our global team.
LabVIEW Case Studies | Projects
Endurance Tester using NI cRIO
Endurance Tester using NI cRIO
Multiple International Deployments Helps Prove Product Meets Spec.
Each endurance test can run upwards of 6 months.

Client: Major Automotive Component Supplier
Challenge
A new endurance test system was developed to give more precision in the control setpoint. This additional precision enabled potential clients to review the product performance in real-life situations. Each endurance test can run upwards of 6 months.
Solution
The updated endurance tester supports product validation by providing the desired parameter control method, allowing the client to prove more obviously that their part met the stated specification.
Viewpoint developed the software and selected the NI hardware for the first unit. The client is now deploying copies of this system to multiple international manufacturing plants.
Benefits
- Able to prove meeting a particular product specification of interest
- Closed loop parameter control
- Data collection
- Configurable Alarms
- Emergency shutdown functionality
System Overview
The cRIO-based endurance tester provides closed loop control, data collection, and alarming with controlled and emergency shutdown functions. The operator can manually configure a test or load a saved configuration. After a manual operator check to make sure the setup is operating correctly, a successful test will run its full duration and stop on its own.
| SOFTWARE FUNCTIONS |
|---|
| Touch PC interface / GUI |
| Closed loop parameter control |
| Data collection |
| Controlled & emergency shutdown |
| Alarming |
| HARDWARE USED |
|---|
| NI CompactRIO |
| NI analog input cSeries module |
| NI analog output cSeries module |
| NI digital input cSeries module |
| NI digital output cSeries module |
| INTERFACES / PROTOCOLS |
|---|
| TCP |
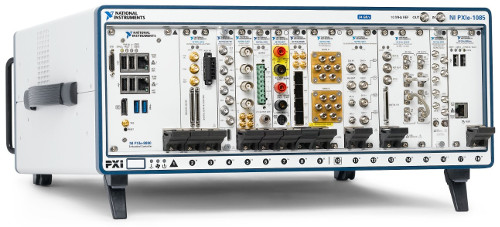
Product Validation using LabVIEW RT & LabVIEW FPGA – Electromechanical Actuator Test Stand
Product Validation using LabVIEW RT & LabVIEW FPGA – An electromechanical test stand for an aerospace actuator
Automated testing reduces operator man hours and increases production throughput.
Client – A manufacturer of actuators in the mil-aero industry.
Challenge
New Product Introduction (in this case a new controller and new actuators) drove the need for a new aerospace electromechanical test stand.
Solution
New NI PXI-based electromechanical test equipment provided automated HIL testing, report generation, and SPC data generation. The sequencing of the test procedure, reporting, and verifiable results were managed with the StepWise test executive platform.

Benefits
- Automated testing reduces operator man hours and increases production throughput.
- Meets strict customer requirements regarding testing and data recording in a verifiable manner.
- Automated Test Report Generation.
- Collects data to support SPC (Statistical Process Control).
- Ability to interact with the internal state of the controller FPGA via the LVDS communication link.
System Overview
Viewpoint developed the software and selected NI data acquisition and control hardware for the test stand. There are several layers of software functionality. Also, the modularity of the test stand hardware assures maintainability for future upgrades and reduction of potential obsolescence issues, especially since the “programmability” of the FPGA-based HW allows repurposing via LabVIEW FPGA.
| HOST LABVIEW SOFTWARE LAYER |
|---|
| Test sequencer |
| Test steps (e.g. Frequency Response, Step Response, Dynamic Stiffness, Fault Response, Power Consumption) |
| Test Report Generator |
| GUI |
| REAL-TIME (RT) LABVIEW SOFTWARE LAYER |
|---|
| Data acquisition |
| 1553 comms |
| Function generator |
| Error detection |
| ESTOP |
| LABVIEW FPGA SOFTWARE LAYER |
|---|
| Synch data from 3 sources (tester, UUT, external DAQ device) |
| Stream high-speed data to disk |
| Stream high-speed data to analog outputs for HIL test |
| Custom communication protocol used by UUT over LVDS lines |
| HARDWARE RECOMMENDED |
|---|
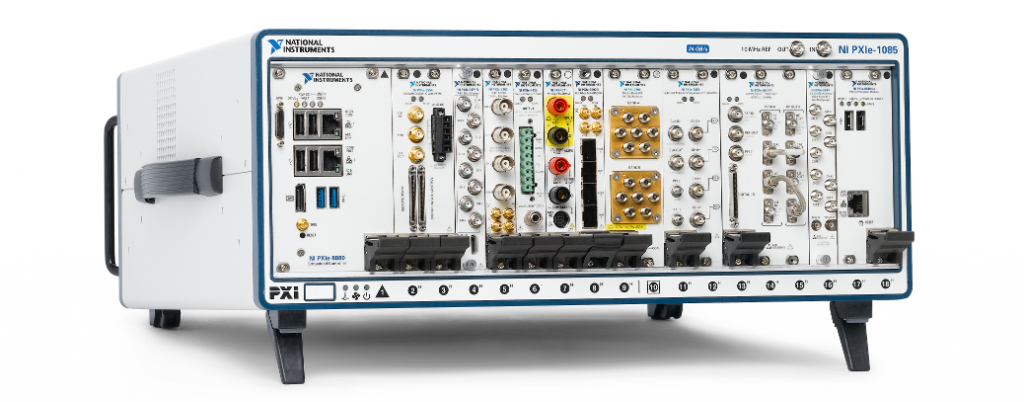
| NI PXIe |
| NI FlexRIO card with LVDS adapter module |
| Multiple NI R Series cards |
| High speed, high voltage, isolated analog input cards |
| INTERFACES / PROTOCOLS |
|---|
| MIL-STD 1553 bus |
| LVDS |
| Ethernet |
| Custom TCP/IP |
*- images are conceptual only, not actual
Creating an N-Up Tester to handle increased production volume demands
Creating an N-Up Tester to handle increased production volume demands
Enhanced throughput offers ROI payback period of less than 1 year
Client
Automotive Components Supplier / Manufacturer
Challenge
The company makes automotive components in very large volume, several part models each at more than 1 million per year.
The client’s primary concern was conserving floor space. They were completely out of spare manufacturing space.
Solution
Viewpoint created an N-up NI PXI-based Manufacturing Test System. In this case, N=6 because analysis showed that a 6-up electronic part tester allowed the test operator to cover the test time with the load/unload time.
At the high volumes needed, the client needed to parallelize as much as possible. The cost of 6 sets of test equipment and device sockets was less important than speed. Using the equation:
ProfitPerUnit x NumberAdditionalPartsPerYearAfterParallelizing > CostOfTestEquipment,
being able to completely parallelize made the number of extra units per year large enough that the payback time for completely duplicating the measurement instrumentation for each UUT socket was less than about 1 year.
Benefits
- Paid for itself in less than 1 year by the enhanced throughput.
- This approach consumed about 20% the floor space that would have been used for duplicating the test system 5 more times (for a total of 6 testers)
System Overview
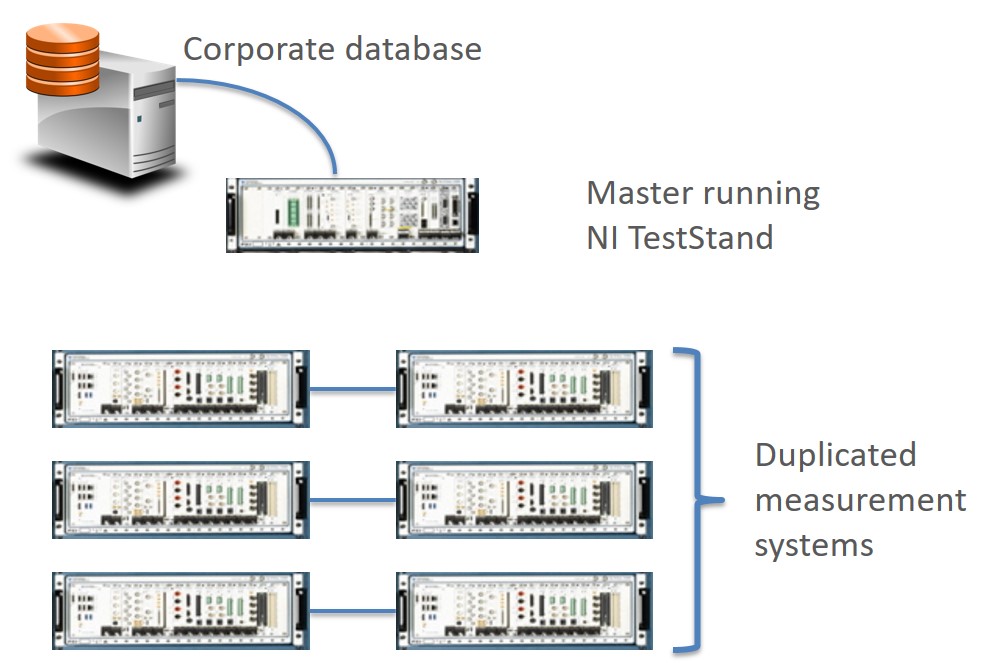
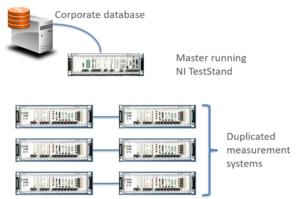
Viewpoint developed an NI TestStand application that ran 6 instances of the test sequence independently of each other utilizing the duplicated PXI-based test equipment. The common parts of the overall master sequence were:
- Startup check for the entire test stand
- Shutdown of the entire test stand
- Archiving the test results into the database
Part handling was managed by a PLC and robot which delivered the parts from a tray into the UUT sockets. Digital bits were used for signaling the test sequence which parts were present in their sockets and ready to test.
| SOFTWARE FUNCTIONS |
|---|
| Test System GUI |
| Test sequencer |
| Startup checker |
| Test Results Archiver |
Increasing Test System Automation for Existing Tester to handle Production Volume Demand Increase

Increasing Test System Automation for Existing Tester to handle Production Volume Demand Increase
Reduced test time across several products by an average of ~25% and reduced time to create paperwork by ~3x
Client
Manufacturer of high-voltage power supplies
Challenge
The client already had an existing manufacturing test system in place. They wanted Viewpoint to enhance the tester due to an increase in production volume demand. Viewpoint reviewed the existing test system and noted 3 areas for improvement:
- Automation available in the measurement instruments – most of the test equipment was automatable, via some combination of serial, GPIB, or Ethernet interfaces. Furthermore, some equipment, such as an oscilloscope, had the ability to store and recall setup configurations. The test operators already used these configurations to decrease setup time for the next test step. Most test equipment did not have automated setup.
- Operator time spent on each test step – the client had been through a Lean assessment and had already done a good job of timing operations. However, we specifically noted that the operator was manually connecting to the test points and manually transcribing to paper the measurement results from instrument displays.
- Automating the connections – many types of product models were being tested at this test system. Connecting the test equipment to all sorts of products would require either 1) many types of test harnesses and connectors or 2) a redesign of the products to make test connections simpler and quicker.
Solution
The enhanced automated test system included automation of instrumentation interfaces, a test executive to run the test sequences, automated test report generation, and automated test data archiving for the electronic UUT.
Benefits
- Reduced total test time across several products by an average of ~25%.
- Time to create paperwork was reduced by ~2/3 due to automated data collection.
System Overview
The enhanced test system included the following updates:
- Test sequence automation
- Automated test report generation
- Automated test data archiving
- Automation of instrumentation interfaces
- Configurable automated test steps associated with each type of measurement instrument. The test operators would create a sequence of steps to setup each instrument and record the resulting measurement. The sequence of steps could be saved and recalled for each product to be tested, so the instruments could be used automatically.
- New programmable meter – integrated the new DMM meter with a programmable interface to replace the one that was not automatable.
- Foot switch integration – Since the connections to the test points were manual, a foot switch allowed the operator to take the measurement and advance to the next step.
The StepWise test executive platform managed the multiple test procedures created for the different products. StepWise also handled creation of HTML reports for every part tested.
| SOFTWARE FUNCTIONS |
|---|
| Test GUI |
| Test Sequencer |
| Report Generator |
| Test Data Archiving |
| Instrument interfaces |

Product Validation & Production Test System – For complex Mission-critical sub-system
Product Validation & Production Test System – For complex Mission-critical sub-system
Client
Ensign-Bickford Aerospace & Defense

Upgrade reduces per unit test time by ~40% and improves reliability of software
Challenge
The customer needed to upgrade their existing test system. Their old test system was very manual:
- It did not provide ability for unattended operation
- The thermal control had to be set manually
- They wanted to do less manual review of the data
The client develops mission-critical products, so there’s a desire to reduce manual operations because they have to explain any anomalies, and manual operations are typically more error-prone. They needed repeatable results that they could trust.
Solution
Viewpoint developed a new test system that utilized new hardware and software, augmented by existing low level hardware and firmware. The test system was developed to perform both functional test for production and environmental testing, and was designed to handle up to 4 DUTs at once. The test system utilizes the StepWise test executive software with custom test steps, which allowed the client to create their own highly configurable test sequences. The system was developed in two phases, with the second phase adding support for a FPGA expansion backplane (NI CompactRIO chassis) in order to provide future capability for bringing some of the microcontroller sequence activity into the NI space. In addition, the previous version had a mix of serial, TTL, and USB instrumentation, which was not as robust as Ethernet based instrumentation. Phase II involved upgrading to all Ethernet based instrumentation, and did away with the original test system’s many manual toggle switches that could be used instead of the programmable mode through the SW.
Benefits
- ~40% test time reduction per unit
- ~25% reduction in anomalies that needed to be justified
- ~500 manhours saved in test execution
System Overview
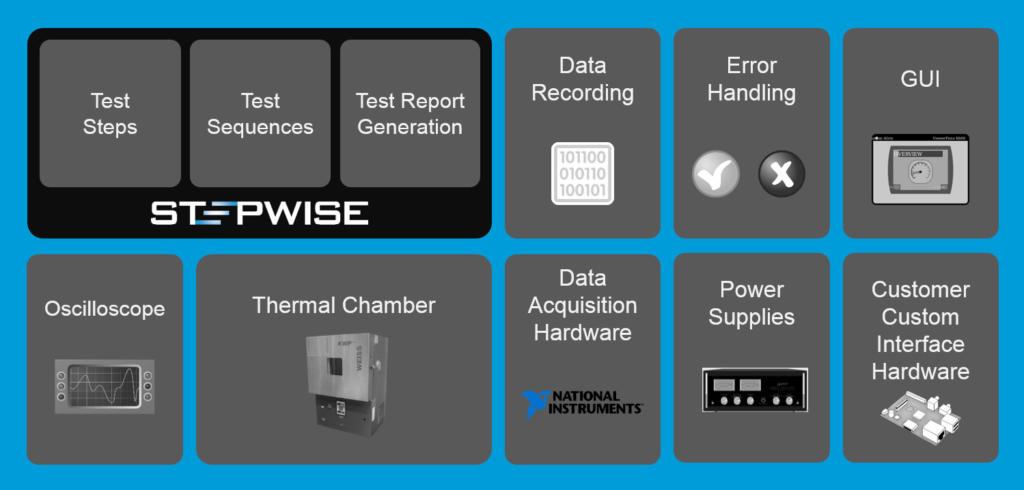
| Software Functions |
|---|
| Test sequencing |
| Test report generation |
| Data recording/logging |
| Error handling |
| Test GUI |
| Oscilloscope interface |
| Thermal chamber interface |
| Power supply interface |
| External custom hardware interface |
Industrial Equipment Remote Online Condition Monitoring

Industrial Equipment Remote Online Condition Monitoring
Using NI CompactRIO
Client
A manufacturer of large industrial mission-critical equipment in the electrical energy / power industry.
Challenge
Our client had three main goals in mind. They wanted to:
- Decrease unanticipated downtime and maintenance expenses
- Provide a more complete picture of machine operation and state
- Improve equipment usage tracking.
Solution
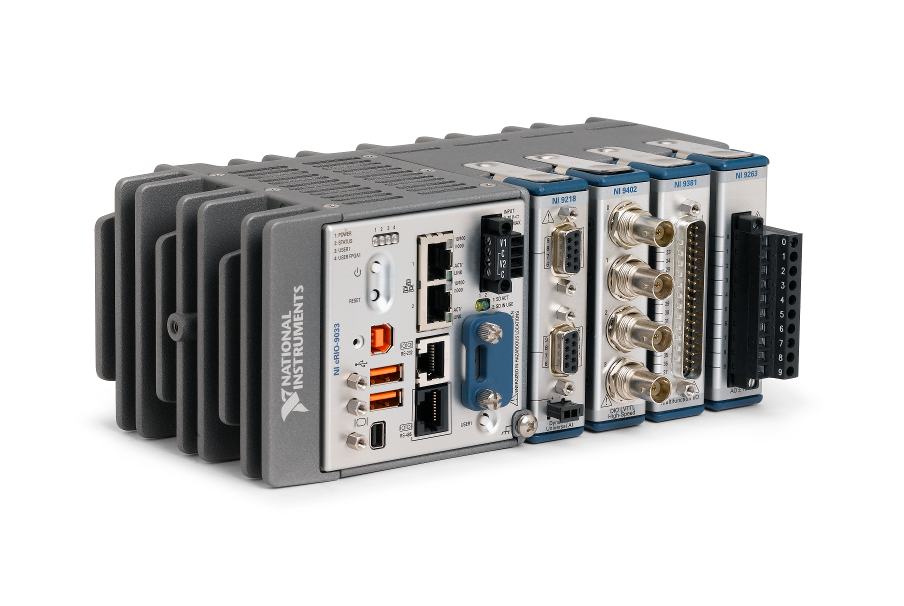
The solution is a multi-node (i.e. multi-site) remote monitoring system that utilizes an NI cRIO-based controller with customized NI InsightCM monitoring software.
Benefits
- Monitors vibration signals to predict expensive equipment failures
- Monitors current machine state via Modbus from other equipment in the system, including the primary system controller
- Provides alerts via email when any designated parameter is out of range
System Overview
The remote monitoring system monitors equipment condition by taking several vibration signal measurements along with reading over 500 Modbus registers. Local InsightCM vibration analysis on the cRIO extracts key features from the accelerometer data. Limit detection is run on these features and other equipment state and alarms are triggered when data is out of bounds. Information collected at multiple sites is sent to a central location either at periodic intervals or based on an alarm condition.
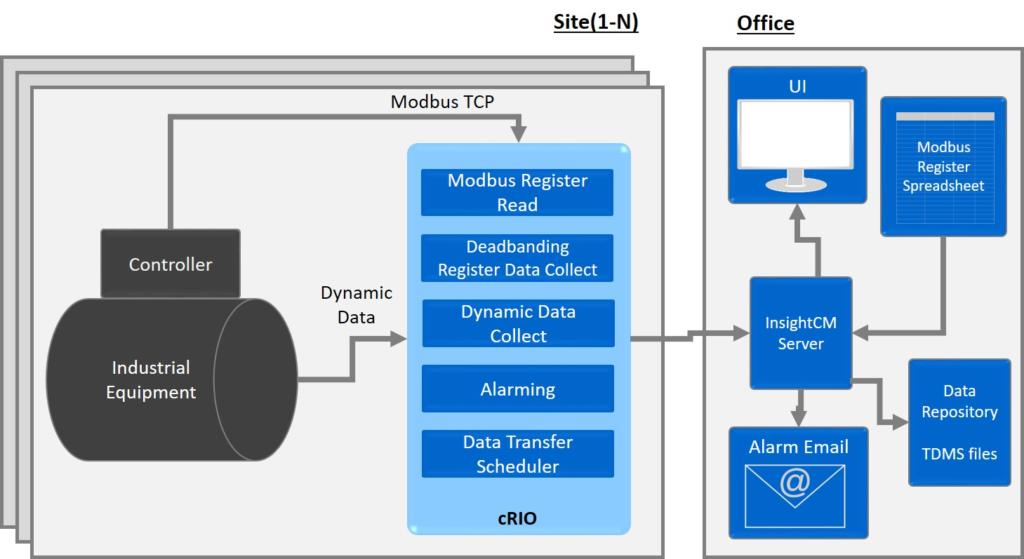
| SOFTWARE |
|---|
| NI InsightCM software |
| Modbus register configuration & reading |
| Dead banding-style register data collection to decrease amount of data captured and transferred |
| Dynamic signal data capture |
| Alarming detection |
| Data transfer scheduling |
| Semi-real-time alarm channel display |
| HARDWARE USED |
|---|
| NI cRIO |
| NI IEPE Analog Input Module |
| Microsoft Windows Server to host the NI InsightCM server software |
| INTERFACES / PROTOCOLS |
|---|
| Modbus TCP |
| Ethernet TCP/IP |
Manufacturing Test Data Logger
Manufacturing Test Data Logger
Data Acquisition System Facilitates Continuous Improvement of Product Performance
Client – A manufacturer of welding consumables

Challenge
Our client produces welding consumables. These products are inspected for continuous improvement of product performance. Our client wanted to standardize their data collection method to improve product quality and utilize SPC (statistical process control) across multiple international manufacturing facilities.
Solution
The solution is a relatively straightforward data acquisition system measuring force, vibration and voltage for comparison across multiple international manufacturing facilities to support continuous improvement of product performance.
Benefits
- Standardization of data collection across multiple manufacturing sites
- Ability to check product performance tolerances, which could trigger root cause analysis
- Ability to analyze data across product runs and across sites for SPC
System Overview
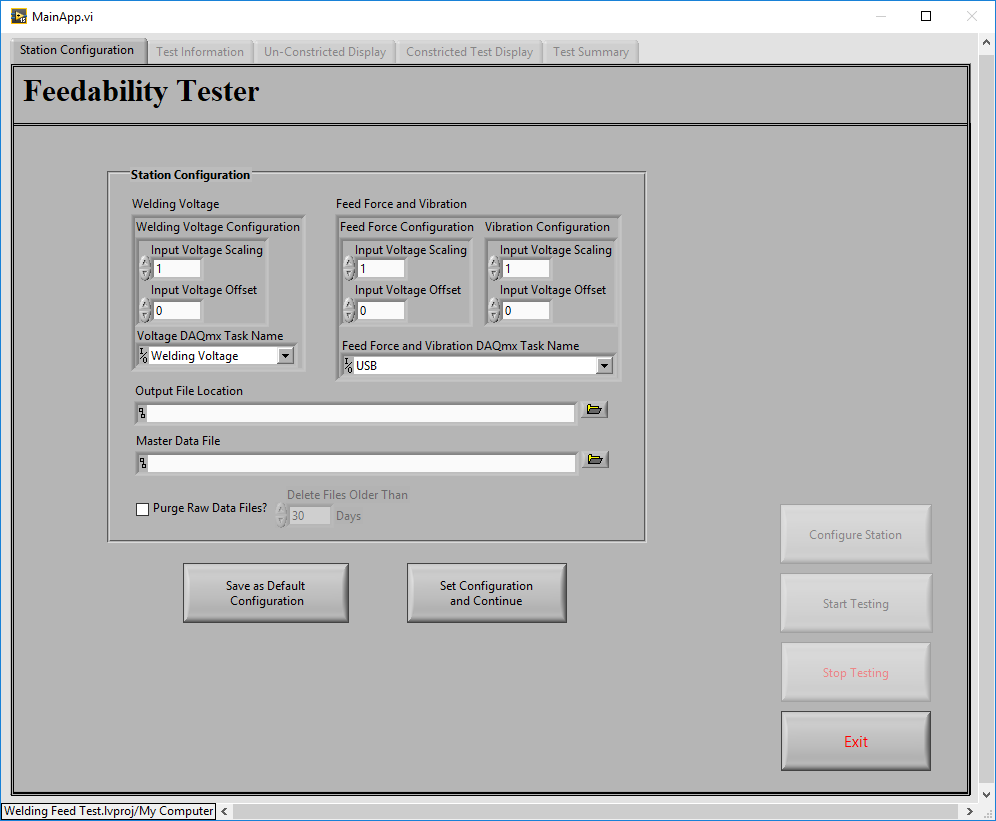
The system utilizes off-the-shelf data acquisition hardware from National Instruments along with custom LabVIEW code to perform force and vibration measurement and basic calculations such as RMS Min and Max. Each test generates an MS Word file showing summary data as well as graphs of each attribute over time. In addition, the program creates (and automatically archives) a complete data set of all data recorded during the trial and finally adds a line with all the summary results and comments to a Master log file. This Master log file can then be sorted by date, wire type, diameter, or any other input for analysis.
| SOFTWARE FUNCTIONS |
|---|
| Calculations (e.g. standard deviation, RMS, Max) |
| GUI for configuration, control, and results. |
| Automated Report Generation |
| HARDWARE USED |
|---|
| NI cDAQ |
| NI C Series voltage input module |
| NI USB Multifunction I/O Device |
| INTERFACES / PROTOCOLS |
|---|
| USB |
Custom Manufacturing Inspection System – with Machine vision and Advanced Motion Control
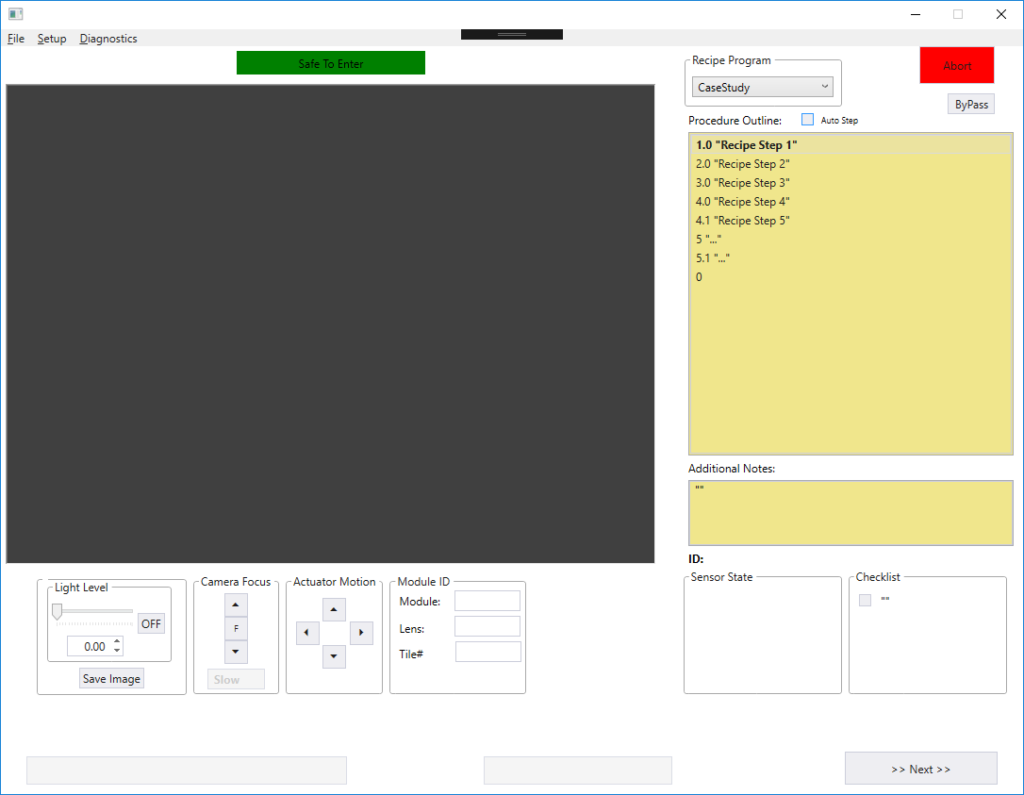
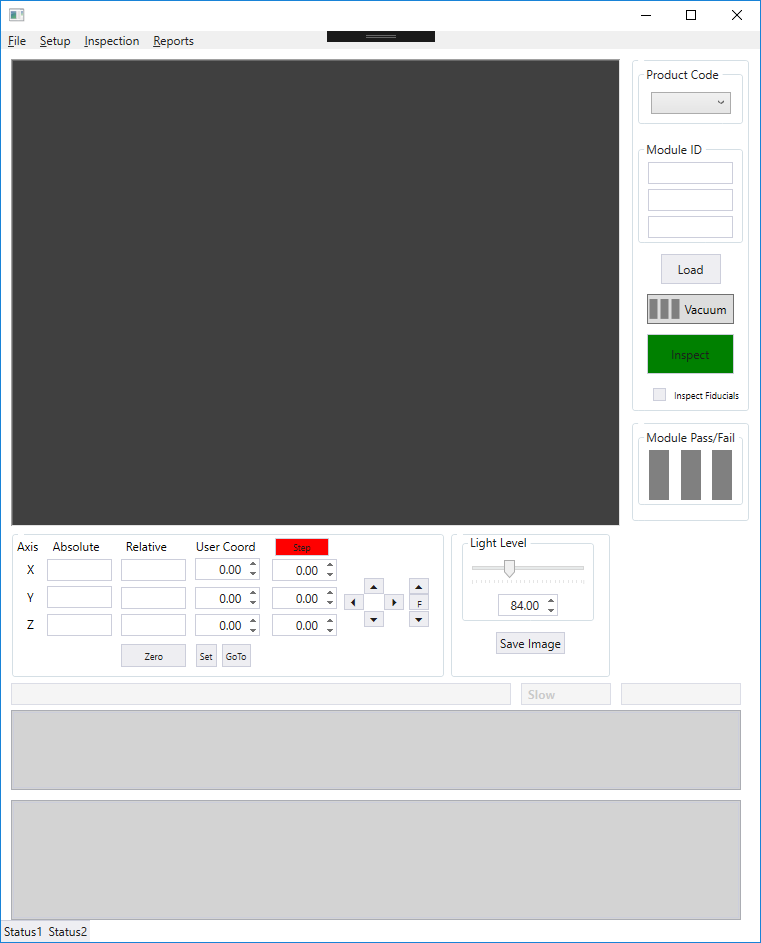
Custom Manufacturing Inspection System
with Machine Vision and Advanced Motion Control
Client – Xerox
![]()
Challenge
Our client had an old manufacturing inspection system (really two systems: one inspection system and an assembly/inspection system) that would no longer be supported by IT and was going to be removed from the network. They needed the operating system updated, so they decided to take this as an opportunity to port the old code from VB to C#.NET, as well as update some hardware.
As migration projects often do, this effort began by working with the client to solidify requirements, followed by a reverse engineering effort to understand the old system to try to make it match the new system as much as possible.
Solution
The updated manufacturing inspection system (one inspection system and an assembly/inspection system) included a new operating system, ported code, new motion control software, new machine vision software, and a new GUI.
Benefits
- OS Update – Updated operating system that is supported by the IT department and is less of a security risk
- Software Porting – Ported software to more maintainable language
- Measurement Accuracy – Increased inspection measurement accuracy for sub-set of measurements
- New GUI – improved operator user experience by improving readability, reducing # of required button clicks, and adding auto scroll functionality
- Report Generation – maintained existing format to interface with customer database
System Overview
The device under inspection is essentially an image sensor array used for scanning images in high end commercial-grade scanning printers. The inspection system utilizes machine vision and precision motion control to verify the location & orientation of several parts, with measurement accuracy measured in microns.
| SOFTWARE FUNCTIONS |
|---|
| Vision / metrology – pattern match and inspection |
| Camera interface |
| Motion controller interface |
| Command Recipe Decoder |
| Report Generation |
| Camera Calibration |
| Robot Controller Command Interface |
| GUI |
| HARDWARE (SELECTED & SUPPLIED BY CLIENT) |
|---|
| Cognex camera |
| ACS motion control system |
| 2-Dimensional Cartesian Robot & Controller |
| Inspection fixture |
| Power Supplies |
| INTERFACES |
|---|
| EtherCAT |
| Modbus/TCP |
Industrial Embedded Control for Advanced Manufacturing
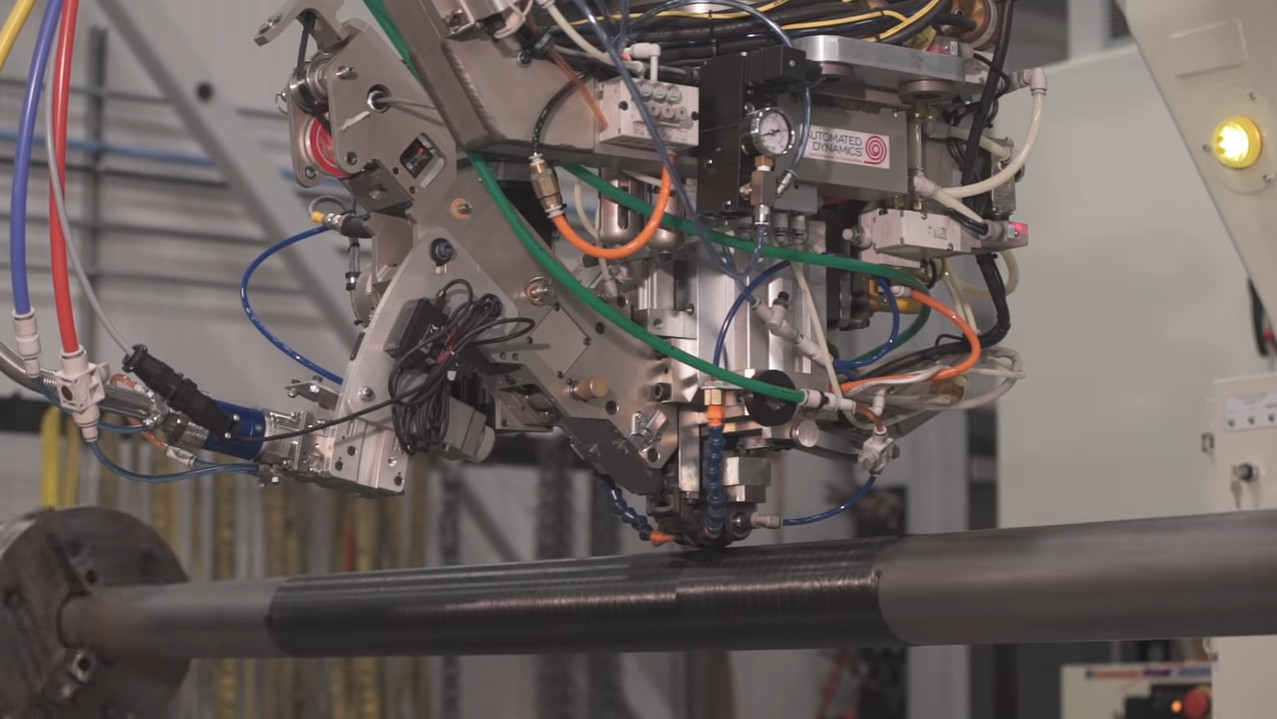
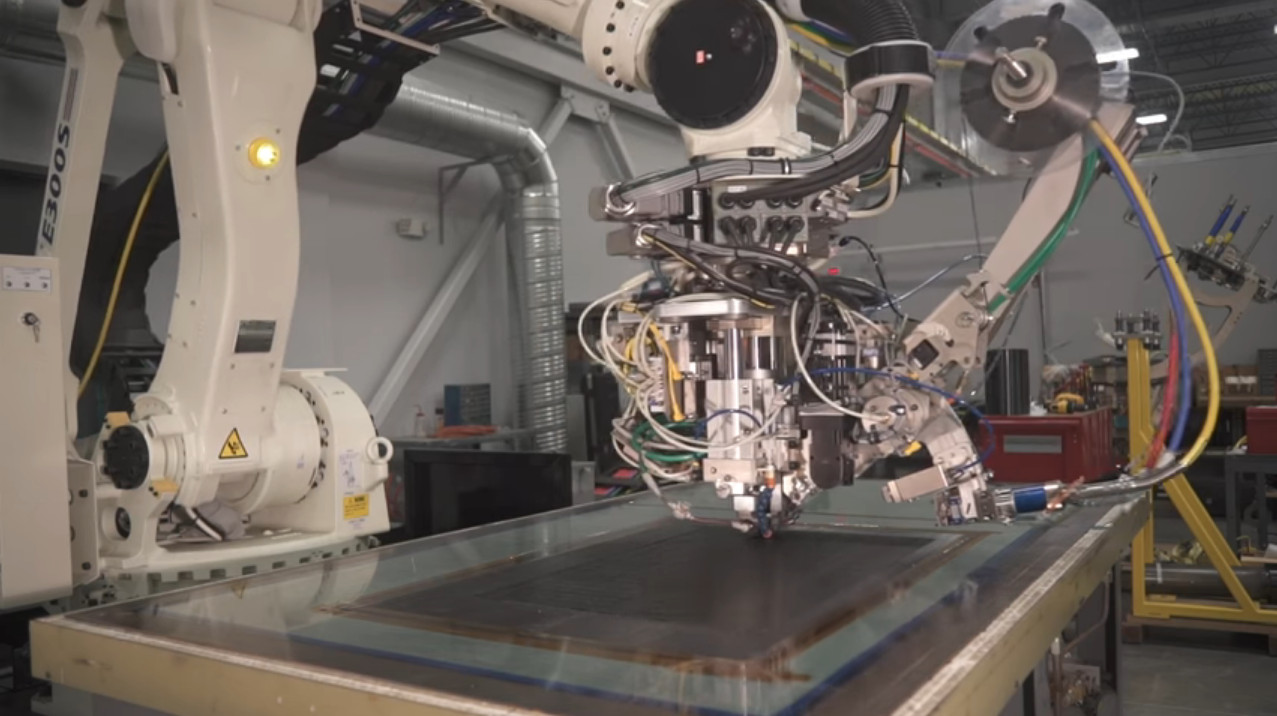
Industrial Embedded Control for Advanced Manufacturing
Energy & Aerospace components manufacturing
Client – Automated Dynamics
Challenge
Utilize laser energy to heat thermoplastic or thermoset composite during an automated fiber placement manufacturing process.
Solution
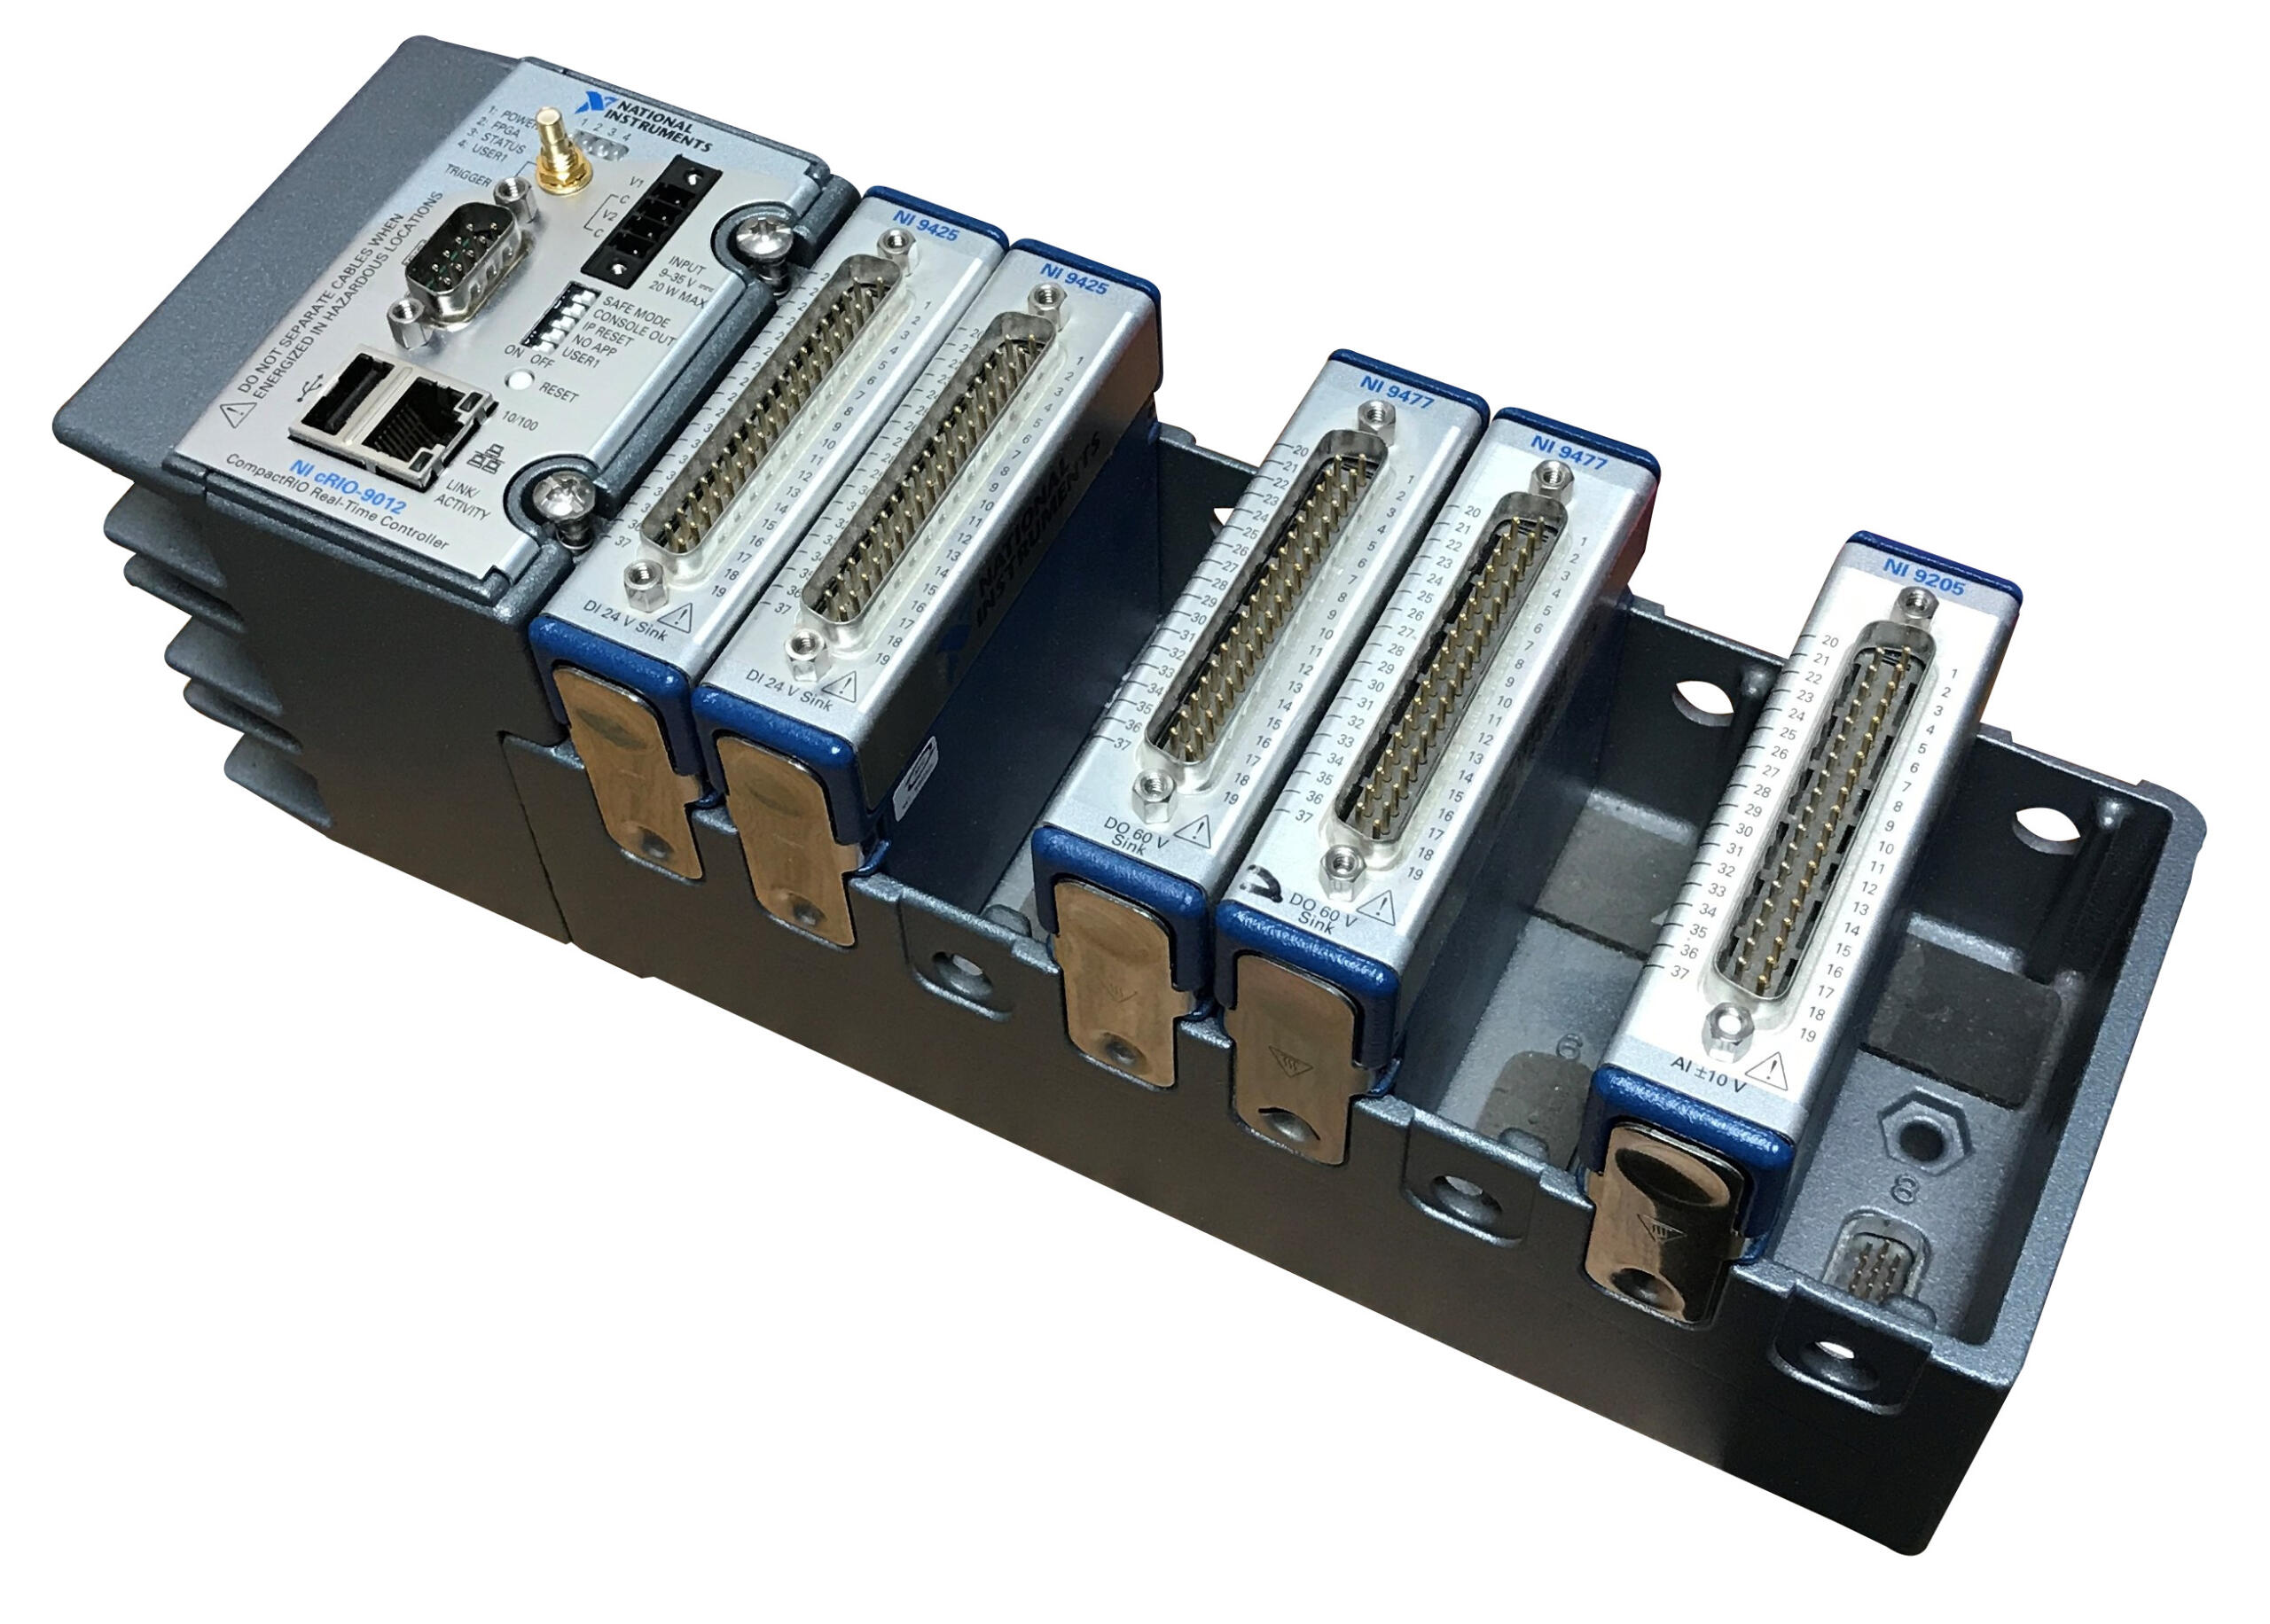
Starting from a proof of concept developed by Automated Dynamics, Viewpoint developed the industrial embedded laser controller software for the automated fiber placement manufacturing equipment. The hardware utilized was an off-the-shelf CompactRIO controller from National Instruments.
Benefits
- High-speed temperature control
System Overview
See it in action here:
Industrial Embedded Monitoring & Control of Manufacturing Equipment

Industrial Embedded Monitoring & Control of Manufacturing Equipment
Adding Closed-loop Precision Control to Manufacturing Process with multiple international plant deployments
Client – Quantum Engineered Products Inc.
![]()
Challenge
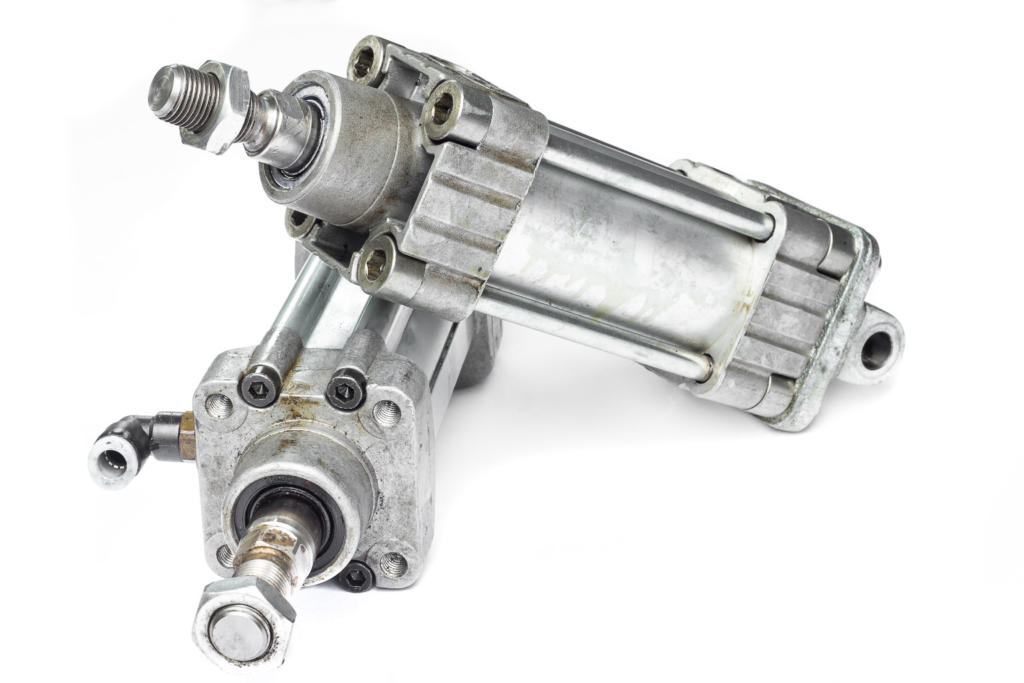
Quantum produces manufacturing machine components that are used in the glass bottle forming process. Specifically, they supply plunger mechanisms that are used in the initial blank side formation of the glass bottle.
The engineers at Quantum recognized that they had an opportunity to improve the bottle formation process by adding position sensing to their plunger mechanisms. The ability to sense and record plunger positions would enable machine operators to monitor the travel of the Quantum plunger into the molten glass gob within the blank side mold, identify and diagnose potential hardware problems, and provide real-time feedback that could be used to better control the process.
Quantum needed a partner to implement real-time control and monitoring of the bottle forming process and selected Viewpoint for the task.
Solution
Viewpoint developed custom monitoring and control software that runs on off-the-shelf hardware. The software developed for Quantum is called TFA™ (Total Forming Analysis). The TFA™ software is a process monitor and control system for the hot side of the bottle forming process.
The software takes position information from the plungers Quantum supplies to the factories to show the travel of the tube during the forming process. The software measures key aspects of the plunger position profile such as initial plunger load position, final position, and dwell time at the final position. When these measurements are found to be out of tolerance, the software communicates with the machine auto-reject system to ensure that bad bottles are removed from the system.
Moreover, the final plunger position is used as feedback to do closed loop control of the glass gob weight, controlling glass feeder tube height and/or needle heights to change the glass gob weight. This allows for precise control of container weight, making the most efficient use of raw materials while ensuring container quality.
To accommodate multiple end-customer-driven hardware configurations, the off-the-shelf hardware selected was based on the National Instruments CompactRIO family of chassis to enable configuration of various input/output signal requirements.
For the end result, check out one of the machines running TFA™ in action:
Benefits
Hardware Customization Flexibility – every one of Quantum’s customers wants something either a little or a lot different with their particular instance of the system. Using modular hardware allowed for swapping of I/O hardware.
Quick Response to Software Feature Requests – Quantum and Viewpoint were in constant communication to be able to implement new features and tweaks on fairly short notice (generally within a couple of weeks).
On-Site Support – Viewpoint engineers travel to Quantum’s customer sites with them as a team upon request.
System Overview
The embedded process monitoring and control system consists of custom process monitoring and control software that runs on off-the-shelf hardware.
| NOMINAL HARDWARE |
|---|
| NI 9148 Ethernet expansion chassis |
| NI 9201 module for AI |
| NI 9425 module for DI |
| NI 9476 module for DO |
| SOFTWARE FUNCTIONS |
|---|
| Data Acquisition and Processing |
| Waveform Calculations (eg. final position and dwell time) |
| Final Position control loop |
| Real-time per cavity plunger position graphs |
| Process trend graphs |
| Forming history graphs, showing a packet of the last forty final positions per cavity |
| Limits definition screens |
| System health summary, fault monitoring and auto-reject configuration |
| Job configuration |
| Plunger sensor calibration |
| COMMUNICATION INTERFACES |
|---|
| Gb Ethernet communication with the DAQ devices (NI 9148 chassis) |
| TCP/IP Modbus communication with Schneider Electric motors for feeder tube and/or needle control |
TFA™ is a registered trademark of Quantum Engineered Products, Inc.
Hidden Factory Assessments Lead to Waste and Cost Reductions

Sharing Business and Test Data Enables Efficiency Improvements
Reduce Production Costs by Coordinating Business and Test Data
Client: A major manufacturer of aerospace components
Problem Scope
Many companies operate in a high-mix, low-volume manufacturing environment. In these situations, production of such parts is often complex, with long assembly and test procedures describing the process to make and verify the part. Discussions of automating any part of these processes are often dismissed because an automated test system is thought to be expensive, especially an aerospace test system which requires significant documentation and acceptance testing efforts. Plus, it’s often erroneously thought that each part needs a unique test system.
Challenge
Our client wanted to improve their capability to manage the assembly procedures and get clarity on the status of any parts, whether partially or fully assembled. The existing situation had data manually-entered into a database form or even handwritten data that needed to be transcribed into a database. Often the database was local to the assembly cell. The chance for error was significant and the lag between data collection and updating the database was often days. When questions arose about the status of a particular unit, many hours could be spent in locating and evaluating the associated forms and paperwork.
The steps needed to achieve these goals were clear: automate the collection data on each part while being assembled so that those results would appear in a business-level database which would give a plant-wide view of the status of all the parts in progress.
Thus, this project needed to allow read/write access to sections of the Manufacturing Enterprise System (MES) database so that information about a part being assembled could be obtained automatically and results could be submitted to that MES database automatically.
Solution
We designed the PXI-based system based on the StepWise test executive platform to automate the assembly and testing. This platform enables two significant changes. These changes were made at each assembly cell by having the operator use a test PC and perhaps some measurement equipment as appropriate for the part(s) being assembled at that cell.
First, we replaced all the printed assembly procedures with electronic records so that any operator could review the latest version of the work instructions on a computer screen. This approach helped with version control, especially important since the client had various model revisions that came through the factor for rework, each with slightly different versions of assembly instructions.
Second, we displayed those electronically documented work procedures as steps in a test executive, allowing the results of each step in the assembly procedure to be captured electronically. When an assembly step was purely manual with no measurements, the fact that step was completed would be recorded, along with information such as the name of the operator performing the step, the duration that the step took, and so on. When a step required a measurement to be made, such as a functionality verification or a calibration result, the measurement would be collected. If the equipment making that measurement could be automated, we would collect that data automatically, and not require the operator to type the result into a computer form.
The outcome of this effort has enabled the client to get a snapshot of the status of parts in assembly, i.e., Works in Progress (WIP), quickly and accurately.
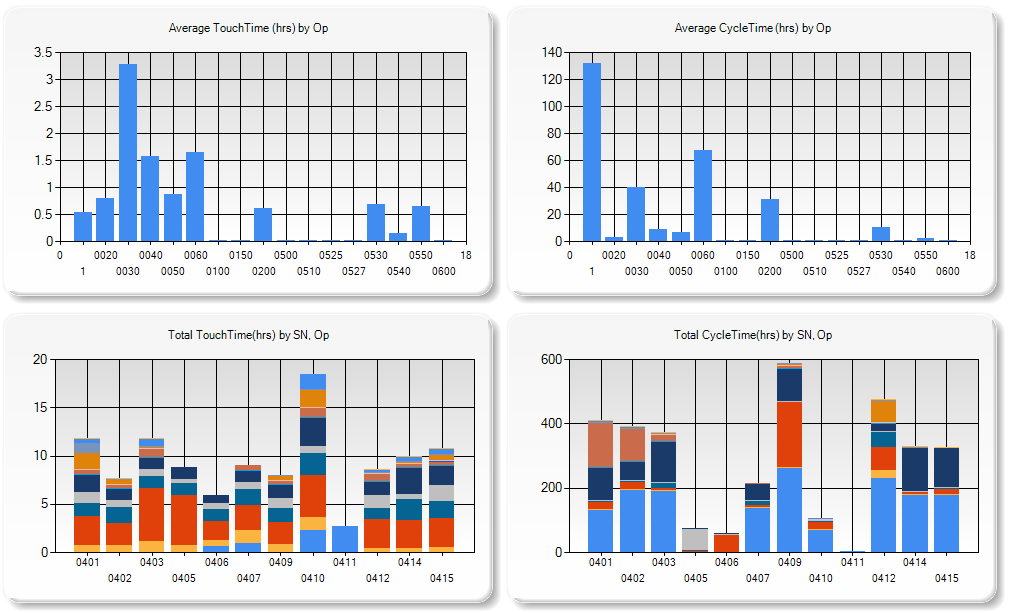
After these changes were made, many additional capabilities are now available with the advent of purpose-built queries into the appropriate MES database tables. The table below shows the overall efficiency gains achieved.
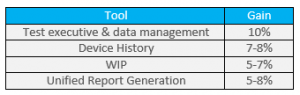
The key is the combination of the electronic test results obtained at the test equipment with information on work orders and manufacturing flow held in the various tables in the business MES database. This improvement happens even with manual or semi-automated test systems, and does not require a completely automated assembly and test system. Thus, the cost of the test system is much less than usually expected and, hence, the benefits are more easily cost-justified.
Industrial Embedded – Using a cRIO for Rapid proof-of-concept Prototyping | FPGA-based motor control & RT-based loop control
Industrial Embedded – Using a cRIO for Rapid proof-of-concept Prototyping
FPGA-based motor control & RT-based loop control.
The NI cRIO platform allowed for rapid development/test cycles. There was as little as ~1.5 hours between a software change and a test.

Challenge
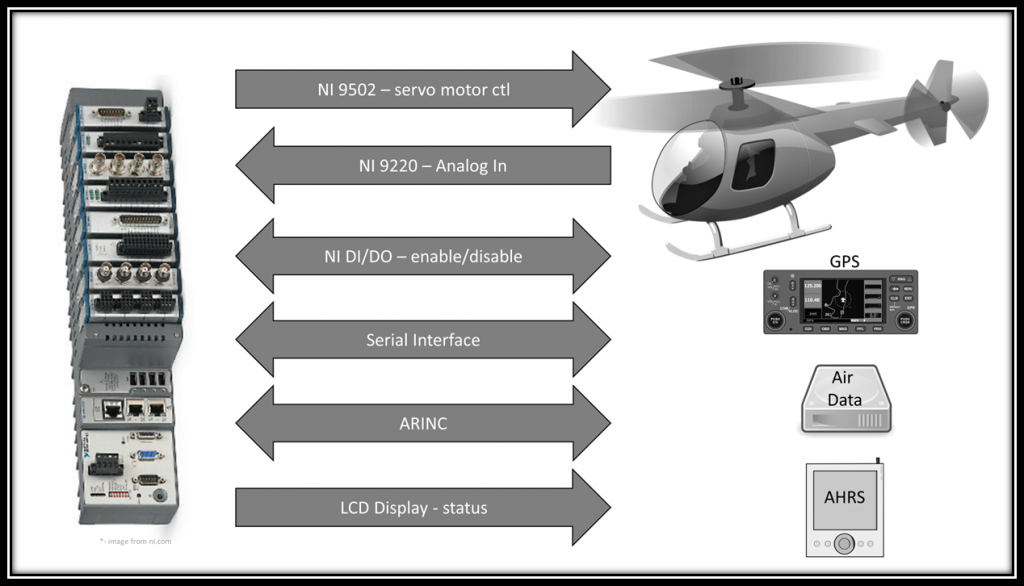
This was a rapid proof-of-concept prototyping effort to quickly determine feasibility of auto-pilot flight.
Solution
The cRIO-based controller was able to allow the helicopter to auto-pilot routed waypoints.
Benefits
The NI cRIO platform allowed for rapid development/test cycles. There was as little as ~an hour and a half time between a software change and flight test. Code updates could be flight tested in the morning, updated over lunch, tested again in the afternoon, updated one more time at night, and flown again the next morning. This allowed for rapid development of control laws.
System Overview
The core system functionality consists of:
- resolver-based BLDC motor control
- position loop control
- vehicle dynamics control
- and flight logging.
Vehicle dynamics control and position control lived on the RT processor, while motor control and critical high-speed processing lived on the FPGA.
Designing an Automated Fuel Cell Validation Test Stand
Designing an Automated Fuel Cell Validation Test Stand
Verifying a New Fuel Cell Design Through Automated Operation
Client: A major automotive manufacturer
Problem Scope
Micro Instrument, an automation vendor that builds product validation and test stands, has extensive experience with programmable logic controllers (PLCs) and stand-alone controllers for controlling repetitive motion, safeties, and other “environmental” parameters such as pressure and temperature. The company typically uses PLCs to reliably deliver discrete I/O control and standard PID loop control.
However, Micro Instrument’s customer, a major automotive company, was interested in investigating fuel cells as a power source and they needed to run these fuel cells under a wide range of conditions for extended durations, for both design validation testing and durability testing purposes. These fuel cells required more advanced control algorithms than could be provided with a simple PID. A more powerful controller was needed.
Challenge
The customer knew they needed control loops that predicted system response so we could eliminate overshoot and/or achieve a faster approach to a setpoint. But, because the customer did not know in advance exactly what such “smart” controls would entail, it was beneficial to have the full power of LabVIEW to develop such controls. Providing this functionality with a PLC would be cumbersome, if not impossible.
The customer had some Compact FieldPoint which they wanted to use for this project, so we needed to ensure that this equipment would be sufficient to deliver the required control performance and tolerances. Also, the system needed to conduct PID control in two forms – PWM and continuous control. Importantly, this Fieldpoint hardware had a real-time controller running LabVIEW Real-Time.
Solution
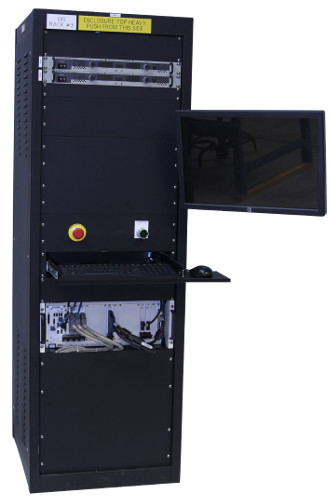
The test system we developed included a 19″ rack test stand populated with fuel piping and control, power supplies, harnessing, data acquisition and control hardware. This hardware was a NI Compact FieldPoint controller, chassis, and modules. The Compact FieldPoint controller was programmed with LabVIEW Real-Time to meet the customer’s system control demands. For example, to predict system response, we programmed the Compact FieldPoint to run control loops that were aware of imminent system-state changes and changed their control schemes accordingly.
As with most validation test systems, we needed to monitor conditions for safety. New product designs are often operated near the edges of safe operation in order for the designer to understand how the product performs in extreme conditions. For this fuel cell application, destructive over-heating and over-pressure could occur. Both digital and analog signals were watched in real-time to assure operation within reasonable bounds and allow a safe shutdown if the fuel cell ran into out-of-bound conditions.
The application used the following independent parallel loops:
- Seven for PWM-based temperatures control
- Two for continuous pressure monitoring
- Four for solenoid and sensor monitoring and control
- 15 safety loops
Data collected during the validation tests were saved to a local PC for later performance analysis and anomaly detection.
The combination of Compact FieldPoint with LabVIEW Real-Time enabled the customer to run the required custom control algorithms and it surpassed the capabilities offered by standard PLCs.
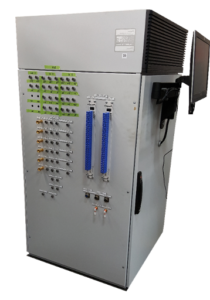
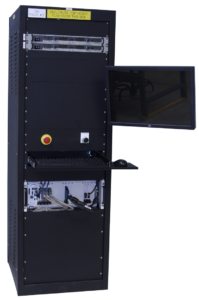
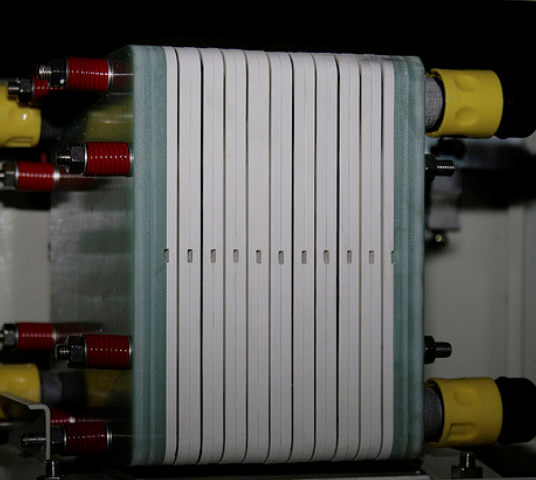
Production Test of Large Uninterruptible Power Supplies
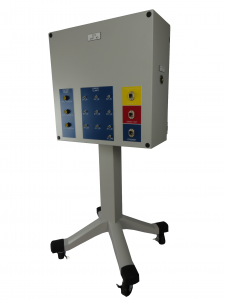
Portable Test Stands for Production Test of Large Uninterruptible Power Supplies
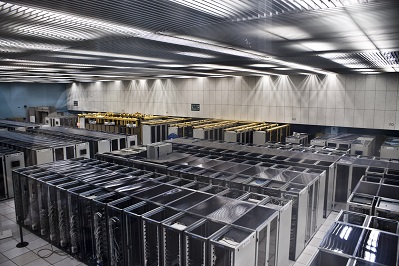
Manufacturing Test of UPS Units Designed for Data Center Backup Power
Client: A major manufacturer of data-critical three-phase uninterruptable power supplies
Challenge
A major manufacturer of very large three-phase uninterruptible power supplies (UPSs) needed better measurement, analysis, and report generation capabilities. Their clients used these UPSs on mission critical equipment, such as data warehouse server farms, communications equipment, and so one. Existing testing procedures used equipment that did not allow for complete simultaneous coverage of all sections of a UPS unit, from input to output. Our client wanted a better understanding of the signals on each of the three phases at various locations within the UPS, especially when power sources were switched or faults were induced. The physical extent of these UPSs could be large, especially when several were combined. Having movable test stands would make access to these test locations less cumbersome.
Also, in the prior test procedure, factory acceptance reports were manually assembled for our client’s end-customers, delaying the final sign-off. Finally, since the end-customer might want to run a specially configured test or run a series of tests in a different sequence than some other end-customer, our client wanted to be able to rerun certain types of tests or run tests in a customer-specific order. Thus, the test sequencing needed to be flexible and editable, possibly on the fly.
Finally, synchronization between the data collection on all signals was critical to assess functionality, since all 3-phases of the UPS output needed to be in the proper timing relationship.
Solution
At a high-level, the majority of testing a UPS relies on knowing the reaction of the UPS to changes on the input side (such as a grid power outage) and changes on the output side (such as an immediate heavy load). Thus, many of the tests performed on a UPS deal with power quality measurements, such as defined by IEEE 519 or IEC 61000 series standards, which cover both continuous and transient operation. The StepWise test execution platform was utilized to allow the customer to develop arbitrary test sequences using the application specific test steps developed for the program.
Our solution used a cRIO to measure both current and voltage from each leg of the 3-phase power (and neutral) by using appropriate cSeries modules connected to various voltage and current test points within the UPS. The cRIO had enough slots to allow a single cRIO to measure a single UPS. This cRIO and connection points were housed in a movable test stand (see image above).
Assessment of continuous operation mainly reviewed the UPS output power quality. Here, it was important to know the amplitude and phase of each leg of the 3-phase power. Synchronous data acquisition between all voltages and current channels was needed for proper timing alignment of collected data points.
Assessment of transient operation was often a review of power ripple and recovery time. For example, in the event of grid power loss, a UPS would switch over to backup power, with the result being a small transient created on the output of the UPS. Again, the voltages and currents needed to be collected synchronously to assure that event timing was aligned.
For increased power capacity, the UPSs could be connected in parallel. When ganged together, the continuous and transient behavior of each UPS needed to be compared to the others, in order to capture the behavior of the entire combined system. Consequently, each cRIO (one per UPS) had to share a clock to enable synchronous data collection across all cRIOs. A timing and synchronization module was placed into each cRIO chassis with one cRIO acting as the master clock source and the others being slaved to that clock. Several test stands were then connected together to share this clock to achieve the simultaneous sampling across all test stands.
The overall test system architecture has a master PC communicating with each cRIO. Each cRIO was placed in certain activity states by the master PC, such as “arm for measurement”, “transfer collected data”, and “respond with system health”. This arrangement enables the number of cRIO-based test stands to shrink or grow depending on the number of UPSs being testing in parallel.
Results
The test system connected the timing module in each cRIO-based test stand in a daisy-chained configuration, leading to data sampling synchronization error of less than 100 ns between all cRIOs, which translates to about +/-0.001 degree phase error for 60 Hz power signals. This timing synchronization was more than sufficient to analyze the collected waveform data for power quality and transient structure.
LabVIEW was used to create various configurable test steps that could be executed in random order as well as in an automated sequential manner. Our client was thus able to test a UPS in a predefined manner as well as react rapidly to queries from their customer when they were viewing a factory run-off test. For example, the customer might ask to re-run the same test several times in a row to validate consistent responses.
Each type of test included automated analysis routines that numerically calculated the relevant parameters against which the UPS was being checked. Not only was this automated calculation faster, but it reduced mistakes and improved reproducibility as compared to the previous post-testing partially manual calculations.
Data from all tests, even repeated ones, on a given UPS were archived for quality control purposes and made a part of the device history for that UPS.
Finally, the report generation capability built into this test system was far superior to the previous methodology by allowing our client to hand their customer a professional report package practically immediately the testing was complete. Customer satisfaction was improved substantially with this state-of-the-art test system.
Manufacturing Test – for mission-critical components

Manufacturing Test – for mission-critical components
Using PXI & LabVIEW RT
Client: A major manufacturer of implantable cardiac and neural stimulators
Challenge
Our client needed several extremely reliable test systems to test the batteries that power their implantable medical devices. These new test systems were needed for two main reasons. First, the needed to upgrade existing obsolete test equipment, based on antiquated hardware and software. Second, new battery designs could not be tested on the old equipment.
A critical aspect of the new test system was the need to detect any excessive charge being extracted from the battery, thus rendering it unsuitable for surgical implantation. Thus, the test system needed to monitor the total energy withdrawn from a battery during testing to assure that it never exceeded a certain limit while also offering precise control of the type of pulses being drained from a battery.
All test results had to be stored in a database in order to maintain device history for each battery manufactured for archiving, quality control, and process improvements.
Solution
The updated manufacturing test system is PXI-based along with a custom micro-controller-based circuit board for some low-level control. Each PXI controller communicated to the microcontroller (uC) on the custom PCB via CAN. The uC controlled the current drain from the battery while monitoring actual current and voltage from the battery at over 1000 samples per second using a precision 6.5 digit PXI DMM. Additionally, each PXI chassis was used to test many hundreds of batteries. Signal connections were handled by several switch multiplexers. Overall control of all the PXI testers was managed by a host PC connected to the PXI controller.
Benefits
- Reduced test system cost vs complete COTS solution with combo LabVIEW RT on PXI and firmware on microcontroller-based custom circuit board
- Enabled tight control of DUT operation on controller with microsecond level responsiveness while being supervised by higher-level PXI RT
- Quick-reaction test abort capability
- Test results stored to database for archiving, quality control, and process improvements
System Overview
In a simplified view, the testing proceeded by pulsing the battery with a series of different durations and varying amperages. The exact sequence of this pulsing is unique for each DUT model. Measurements were made using a PXI filled with various NI boards such as DMMs, for accuracy, and data acquisition cards, for general purpose use.
Additionally, the pulsing amperage levels needed to be tightly controlled in order to know that the tests have been performed properly. Thus, a real-time amperage control scheme had to be implemented to maintain the level requested for the pulse. We chose to accomplish this control via an analog control circuit developed using a custom Viewpoint-developed circuit board. This board was controlled via a Microchip PIC microprocessor. The LabVIEW RT application communicated with the microcontroller to setup the pulsing sequence and coordinate the start and stop of the pulsing and the NI acquisition hardware.
This custom circuitry also reduced the overall cost of the test system by about 40%.
The engineering time to design this custom circuitry was more than offset by the reduction in material costs because more than 10 test systems were deployed, allowing the non-recurring engineering effort to be shared between many systems.
When no critical issues were detected, the waveforms acquired by the PXI system were stored and then analyzed to determine the viability of the DUT. The pass/fail disposition, the waveforms, the total energy consumed, and other test results were then passed along to a host supervisory PC that managed all these results in a database for archiving, quality control, and process improvements, each set of results being tied to the unique unit serial number.
The test systems provided reliable operation for testing the large annual production volumes of the mission-critical DUTs.
Since we designed the system to interface to our customer’s host supervisory PC via ethernet-based commands, the verification and validation (V&V) process could be supported by our customer in their Installation and Operational Qualification (IQ/OQ) efforts. Specifically, they wrote the IQ/OQ procedures around software that emulated interfacing with the host supervisory PC. This approach allowed them to automate parts of the V&V thus saving them almost 1 week of effort.
| SOFTWARE FUNCTIONS |
|---|
| LabVIEW RT – for managing the microcontroller functions and overall data collection and safety monitoring |
| Microcontroller application – to provide precision pulsing of the batteries |
| Communicate to the host PC – to both receive pulsing instructions and configurations and to return pulse waveforms for each battery tested. |
| MAIN HARDWARE COMPONENTS |
|---|
| PXI chassis & controller |
| PXI DMM |
| PXI analog input modules |
| SCXI multiplexing switches |
| INTERFACES / PROTOCOLS: |
|---|
| Ethernet TCP-IP |
| CAN |
How to select a LabVIEW consultant
Maybe you’re LabVIEW programmer quit or retired, or maybe you’ve got some internal capabilities but need some additional support because everyone’s too busy. From hourly rates to a range of skills, there are several factors to consider. We’ll help you weigh each one. See How to Select a LabView Consultant.
LabVIEW developers: local vs remote
Headquartered in Rochester NY, we help customers all over the U.S. See the Pros and Cons of a local vs remote supplier for LabVIEW-based test system development.
3,000+
LabVIEW solutions deliveredGreat for automated measurement & control: manufacturing test, product validation, machine control and condition monitoring.
700+
LabVIEW FPGA systems deliveredGreat for applications requiring seriously deterministic timing, reliable code execution, and multi-channel synchronized processing.
1,000+
LabVIEW RT systems deliveredThe combination of LabVIEW RT and the RTOS on which it runs allows for the creation of applications with bounded jitter and latency.
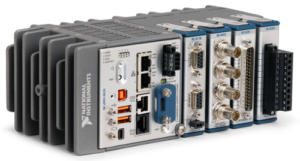
500+
cRIO-based systems deliveredCombining a cRIO controller with the multitude of C Series modules creates a functional real-time controller in a small footprint.
1,500+
PXI-based solutions deliveredBroad range of off-the-shelf expansion cards & processing horsepower make PXI a formidable choice for many automated test applications.