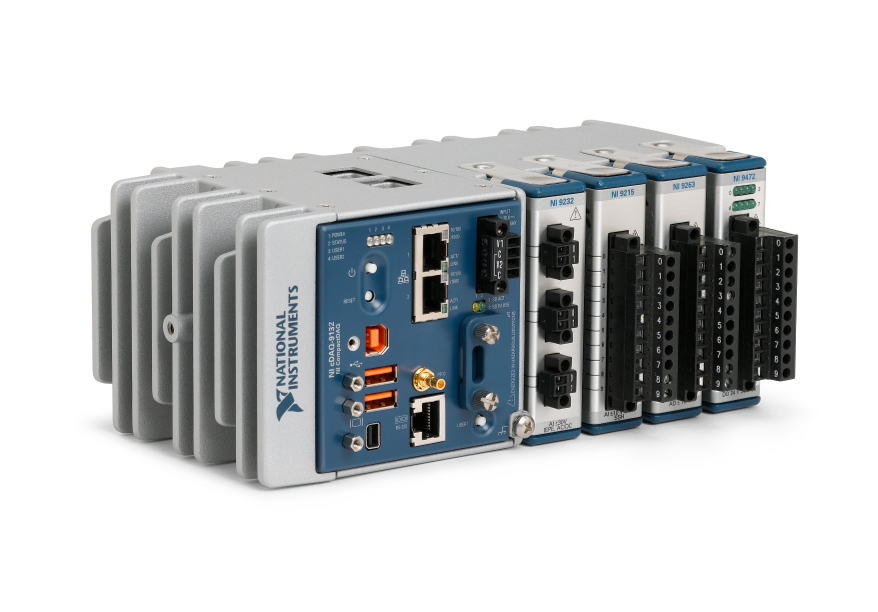
NI Hardware Selection Services
PXI | cRIO | cDAQ | Modules | Sensors
Over 2,000 custom LabVIEW-based automated test systems delivered

Confused about the vast catalog of NI hardware options?
Want confirmation that you’re on the right path?
How we can help
Selecting NI hardware can be daunting. We’ll work with you to:
How it works
Typical scenarios along the path to selecting NI hardware:
We can step in to help anywhere along the path.
Once that hardware list (i.e., the BOM), is complete, you can purchase the components through us at the same catalog price offered by NI. Components from other vendors will have a small markup for ordering and handling.
Benefits of having Viewpoint help
Capabilities & Expertise
NI platform selection
NI software selection
NI module selection
Supporting hardware selection
Sensor selection (common, but not exhaustive, measurement types)
Case Studies
Manufacturing Test System – Aircraft turbine blade quality inspection
Manufacturing Test System – Aircraft turbine blade quality inspection
Improving quality by detecting blocked holes in aircraft turbine blades with an automated test system

Client – Large aerospace company
Challenge
Fuel-fed aircraft turbines run extremely hot. At very high temperatures, a turbine’s blades suffer a shorter life span than if run at cooler temperatures. Consequently, turbine manufacturers put cooling holes in the blades to lower the blade temperature during operation. These holes carry cool air or gas from the blade mount along channels that eventually arrive at holes in the blade surface. This practice keeps the blade much cooler than without the flow.
Some blades have a huge number of holes. Inspecting that each hole is open and has sufficient flow is time-consuming and, if inspected by a person, prone to error due to boredom and distraction. Plus, carpal tunnel syndrome issues are present due to repetitive motions. Multiply these issues by the large number of blades in each turbine and inspection becomes a significant effort.
Our client wanted to implement an automated inspection station to increase throughput and decrease mistakes. Sending defective blades down to the subsequent manufacturing steps is pure manufacturing waste when they are rejected at some later step. Reducing operator injury was also important.
Image courtesy of CC by 4.0 https://creativecommons.org/licenses/by/4.0/ from Zhang, R.; Liu, P.; Zhang, X.; Xi, W.; Liu, J.; “Recent Developments in the Aerodynamic Heat Transfer and Cooling Technology of Gas Turbines Endwalls”. Aerospace 2023, 10, 702. https://doi.org/10.3390/aerospace10080702
Solution
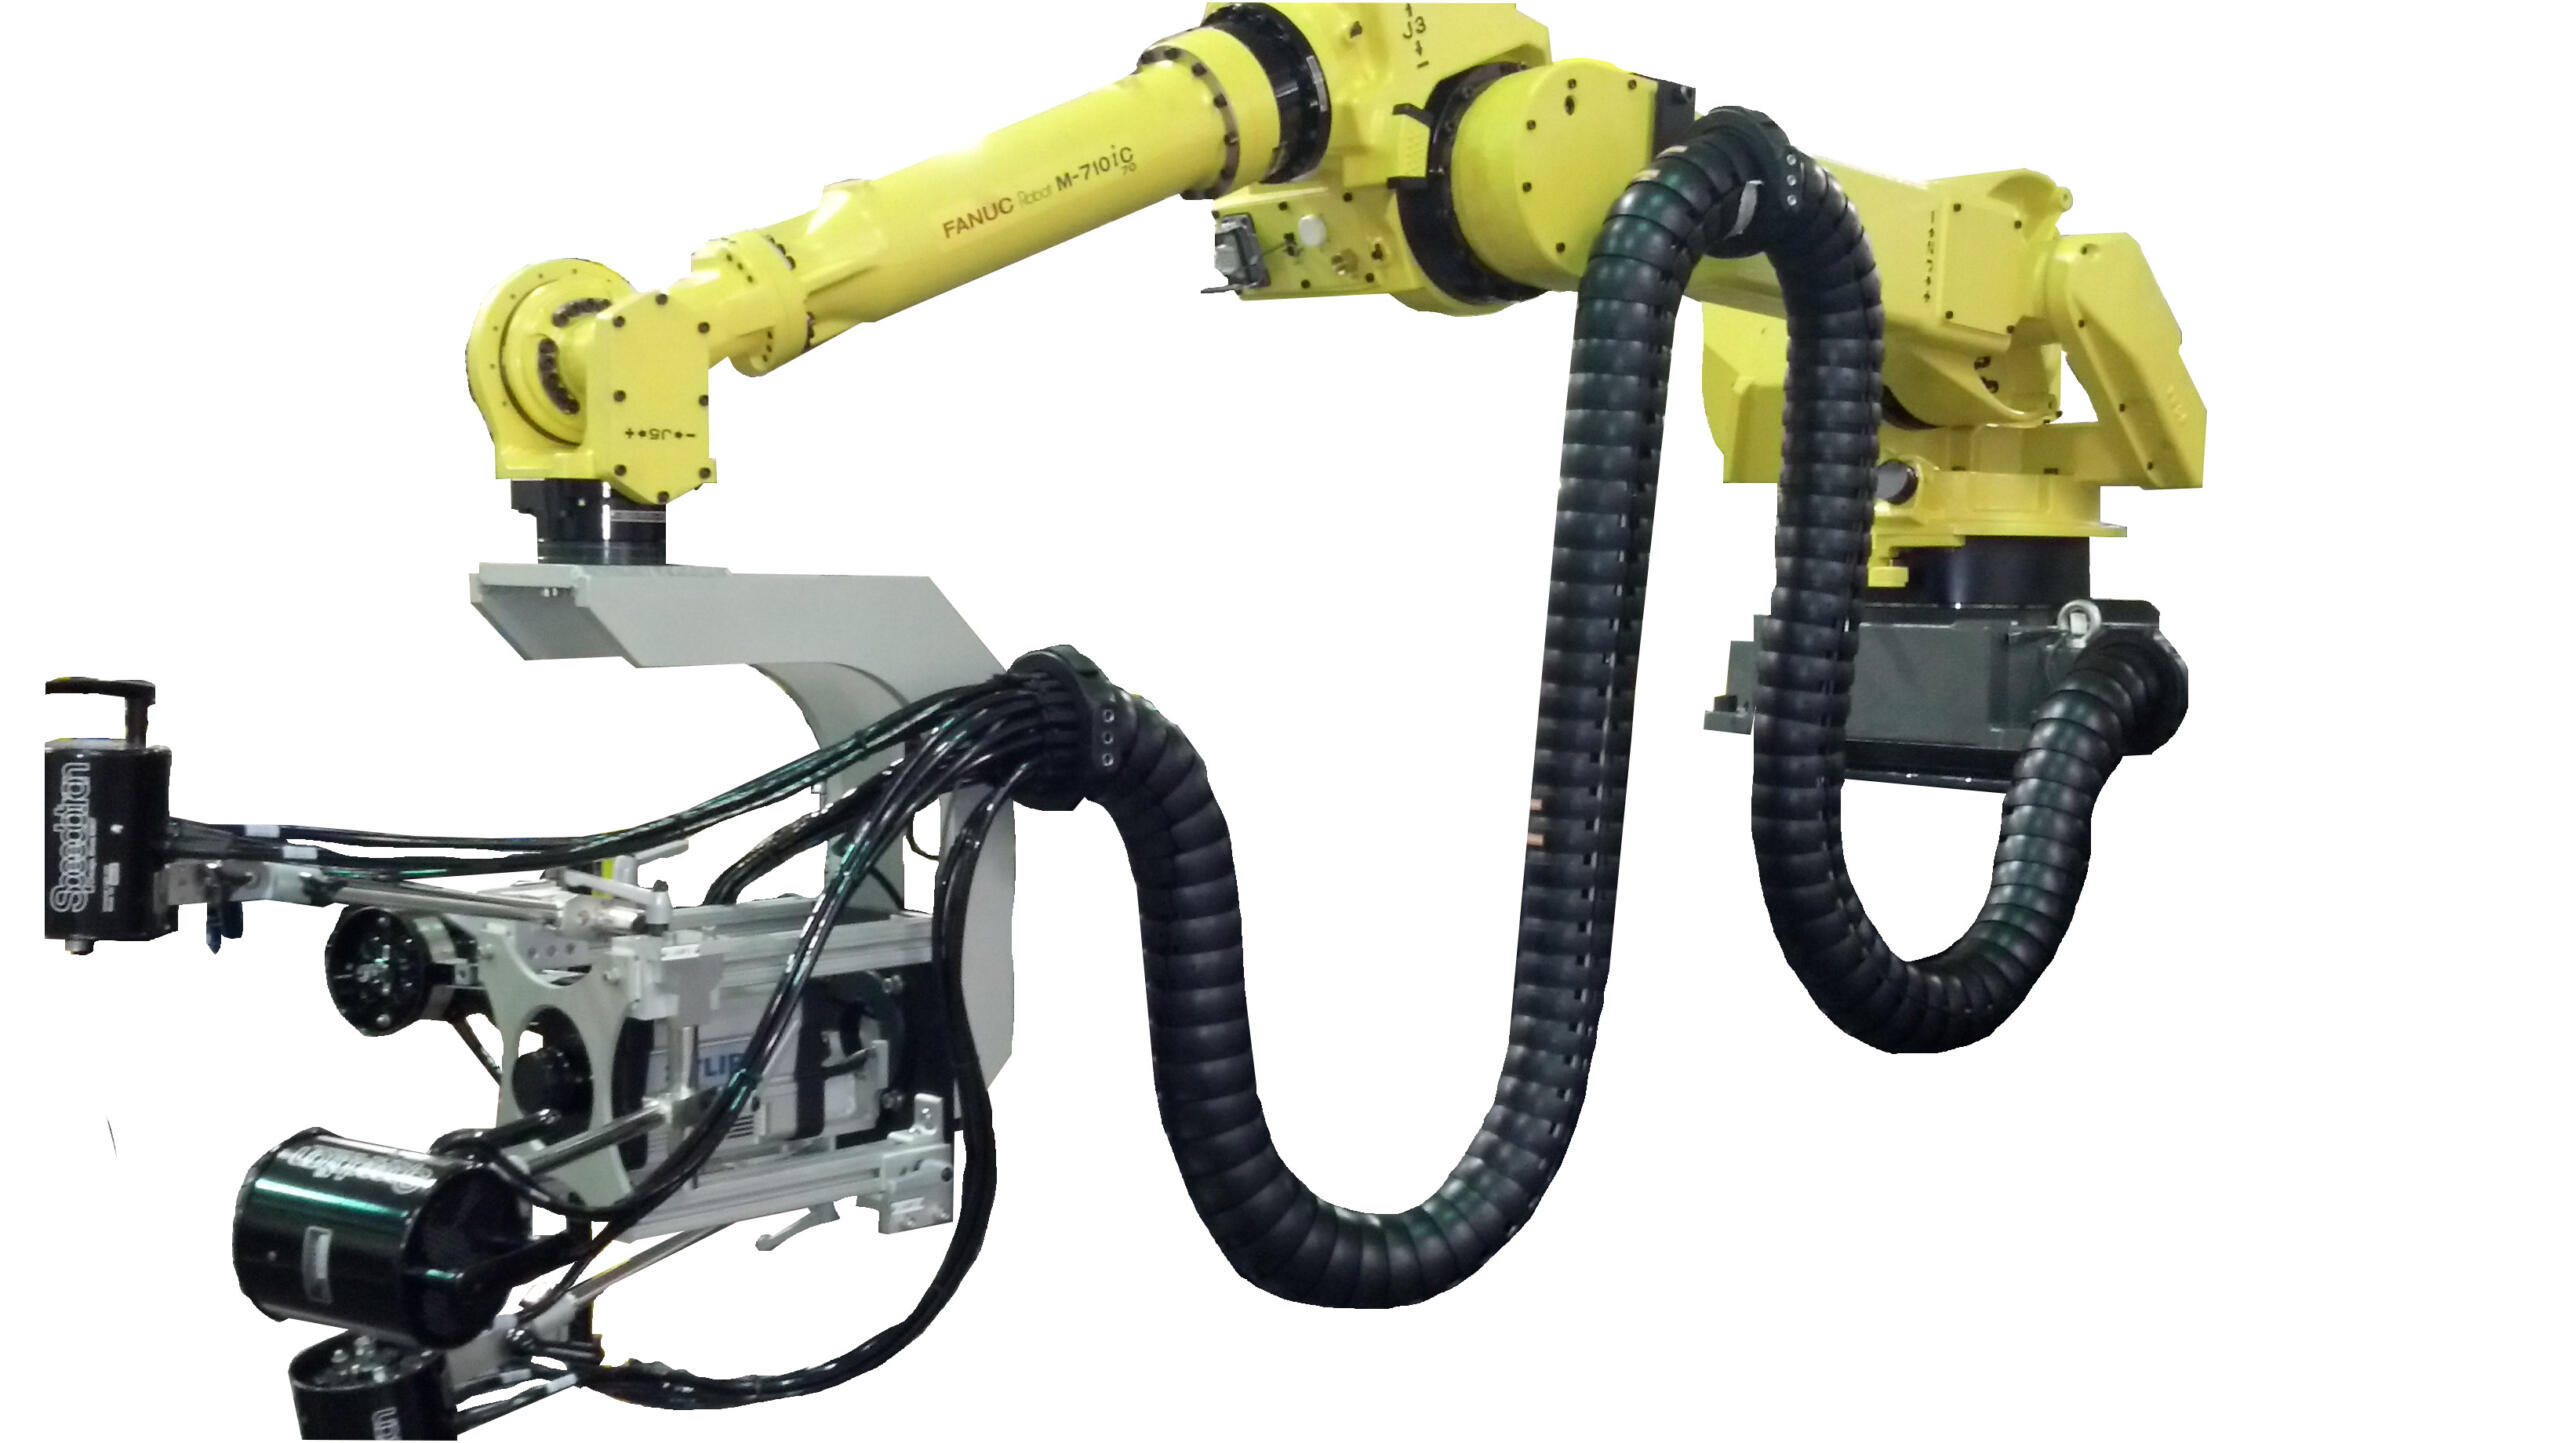
Collaborating with our client, we created a manufacturing inspection system that uses an IR camera and a robot to scan different regions on the blade under inspection. The camera is placed at specific locations and at various viewing orientations to fully inspect all the holes in the blade.
A PC running a LabVIEW test application manages the entire process. Safeties and control of access to the part under inspection are included to protect personnel and product. The system uses hardware sensors and switches and some via FPGA I/O to accomplish this safety monitoring.
Working with our client and our machine builder subcontractor, we helped select the NI hardware best suited for this test system. Our primary focus was on the interface between the IR camera and the system safeties.
Benefits
- The reliability, reproducibility, and speed of the automated inspection augments the operator capabilities
- Improved part quality of parts released to downstream production steps.
- The measurements collected during inspection of each part are available for quantitative analysis of the performance of the manufacturing processes. This post-inspection information helps improve quality all around.
Working Together
This project was the culmination of over 10 years of development effort between our client and Viewpoint engineers.
We started with a basic R&D proof of concept system.
After some tweaks to the process and associated system redesign, we were ready to use a prototype system in a trial run situation where manufactured parts were run manually. This stage gave confidence to those in manufacturing that the system would improve part inspection while speeding up the original manual inspection process. Some changes were made at this stage to decrease costs and improve the test engineer and operator interfaces. It was then placed into the production environment.
Along this entire multi-year development path, the level of automation was increased and the system design was adjusted as we learned from each other about what worked and what didn’t. For example, early in the R&D phase, attention was paid to the analysis algorithms and data required to make those reliable and accurate. And, for the production phase, we changed hardware components to make the test stand hardware less expensive and more robust while reworking the user interface of the software application to be simpler to configure and run.
Both Viewpoint and our client formed a tight team during this journey, with one constant being the Viewpoint engineers involved as the various people on the client’s side changed as this inspection system moved through departments and physical location within our client’s facilities, eventually culminating as a complete test rig with a robot, test stand for data acquisition control, and safety components to protect the operator.
System Overview
The system is composed of the following items:
- Test stand and control hardware cabinet
- LabVIEW test application running on a PC
- Robot and motion controller
- Vision system for IR camera
- NI Compact RIO FPGA digital I/O for controls and safeties
- NI Compact RIO analog I/O for equipment status
- Hardwired safeties and switches for operator and equipment protection
The LabVIEW application manages the entire inspection cycle:
- Assuring a part is present in the nest before starting the inspection process,
- Downloading the part-specific motion profile to the robot,
- Acquiring the images from the IR camera,
- Analyzing the images,
- Compiling the results, and
- Preparing a test report for the part.
Simultaneous with this cycle, the application checks digital and analog I/O for machine status and errors.
If a part model has not been inspected before, the LabVIEW application is used to create the motion profile for that part model.
When the test on a specific part is started, that motion profile is downloaded to the motion controller based on the part type as selected in the application.
After testing a part, the operator is presented with the test results where the option to accept, retest, or reject is offered. The operator is integral to this automated test. In any case, the test data is archived.
When the test is completed, the operator unloads the part for final disposition and loads the next part to inspect.
The LabVIEW application also has a diagnostic mode and configuration editor which is used by the operator or manufacturing engineer to evaluate and tune the inspection process.
The robot movement is managed by a motion controller based on the motion profile created via the LabVIEW application. The PC-based image acquisition is done when the motion controller alerts the LabVIEW application that the part is oriented and positioned within the field of view of the camera. Images are acquired for each of the positions defined in the motion profile.
Safety for both the operator and the part is handled in two ways. First, the Compact RIO FPGA checks system status via digital and analog inputs. Second, hardwired safety sensors and switches assure that the operator is out of the way when the robot starts moving and that the part is in the nest ready for inspection. An example of these “hard” sensors is a light curtain which will cause the system to stop if the curtain is affected during a test.
| SOFTWARE FUNCTIONS |
|---|
| NI FPGA for control and safeties |
| PC LabVIEW test application |
| System configuration |
| Data management |
| Safeties and machine status |
| HARDWARE USED |
|---|
| Articulated robot |
| Vision camera |
| FPGA digital I/O |
| FPGA analog I/O |
| Hardwired safety circuit for personnel and product protection |
| Touchscreen monitor |

Custom Automated Test System – Quantifying Energy and Durability Performance for Refrigeration

Custom Automated Test System – Quantifying Energy and Durability Performance for Refrigeration
Automation reduces manual labor while improving traceability
Assessing performance for improved energy ratings and longevity
Client – Zero Zone – Commercial refrigeration systems manufacturer
Challenge
Zero Zone wanted to improve the capabilities and durability of their new reach-in refrigeration products.
You might think that refrigeration is a mundane product line, but that is just not true! So many innovations are occurring as manufacturers are redesigning their products to improve their environmental footprint through better energy efficiency, coolants, and durability.
Assessment requires an understanding of the performance of the refrigeration units under many conditions. Zero Zone was taking measurements with a datalogger with too few channels, and no synchronization, to other devices that feed into the system. Plus, they had multiple models of their reach-in refrigerators that needed to be assessed. Furthermore, simplifying the data collection and analysis would make it easier to validate against ASHRAE standards.
Zero Zone came to Viewpoint with the following high-level desires:
- Expand the measurements by adding more channels and channel types (e.g., 4-20 mA, ±10 VDC and digital I/O).
- Provide graphs and KPIs to enable faster analysis of the data during the test.
- Minimize the chance of data loss during long test runs.
- Synchronize data collection and actuation.
- Automate storage of measurements per a user-defined period to eliminate manual start/stop of data collection.
- Simplify the manual configuration setup.
- Enable a way to find relevant data perhaps months or years after the test run.
Solution
Viewpoint developed a monitoring and control durability test system that could exercise Zero Zone’s refrigerators through hundreds of operation cycles over multiple conditions to simulate actual usage in, for example, a grocery store.
During initial conversations, we collaborated closely with Zero Zone to brainstorm on some potential approaches. We made some suggestions that could satisfy their desires while also managing their time and cost budgets. Part of that process involved helping Zero Zone in the selection of the cSeries modules, to assure the most effective modules balancing cost per channel, connectivity, and anticipating some possible future needs.
As an example, by automatically populating the cells in an Excel template based on their original systems’ Excel spreadsheet, we provided streamlined report generation without having to rewrite all the calculation code embedded in their Excel file in another app. The compromises we jointly endorsed were:
- Run an app on a PC to configure and monitor the test.
- Use both NI Compact RIO and Compact DAQ to enable robust and synchronized data collection and control with the ability to expand channels by adding modules in both the cRIO and cDAQ chassis.
- Store data on a local PC rather than a remote server to minimize the probability of data lost during the test run.
- Save configurations into Excel files for recall, and cloning, of prior setups.
- Write measurements automatically into the same Excel file for archive of the test setup and measurements.
- Create, in this same Excel file through cell formulas, the summary report from the summary calculations. This approach allowed flexibility for changes to internal and external test standards.
- Upload the summary data and test reference info into a SQL database for data management and long-term test statistics.
Digital outputs (DOs) were used to control various aspects of the test, such as door open/close and defrost on/off cycles. For flexibility, the user can specify the sequencing of these DO channels, in the Excel file used for the test, with various parameters that define the duty cycle, period, number of cycles, and start delay. The timing of these DO state changes was synchronized to the data acquisition by the real-time loop in the cRIO.
This system was deployed to 6 test bays, each one of which might be testing a unit for as little as a few weeks or as much as a few months.
Benefits
The main goal of this project was to reduce the effort and associated human error in the design and execution of the test run.
Some of the primary benefits for this automated system were:
- Reduced Errors: pre-verified template files used for test configuration and data storage lent consistency to test setup and execution.
- Less Testing Time and Effort: the automatic execution of the test and storage of measurements enabled running tests for multiple days (and nights) without technician interaction. Technicians could work on setting up other units for test rather than babysit the existing test. On average, based on the duration of the test time, testing throughput increased by approximately 25% to 40%.
- Shorter Reporting Time and Effort: reports were available about 85% faster than the time previously spent creating manually. The quicker feedback saved costs through early detection of unit problems and faster teardown at the end.
Some additional major benefits were:
- More details on refrigerator operation: “Wow! We never saw that before.”
- Database consolidation: statistical analysis takes hours not days and includes all tests run in the lab, not just ASHRAE tests. This central database enables long term retrieval of all test data.
- Reuse: techs embraced ability to reuse and modify previous setups.
- Consistency: driving the test definition through an Excel file encouraged uniformity.
- Traceability: documented and timestamped calibration measurements.
- Flexibility: channel counts, acquisition modules configuration, calibration, and calculation formulas were straightforward to change for new test setups.
The test automation provided by this system greatly reduced the labor involved in configuring, running, and analyzing the test run. Furthermore, the customer benefited from the consistency that resulted from the software-enforced process.
System Overview
We developed the application in LabVIEW and LabVIEW RT combined with a cRIO connected to a cDAQ via TSN Ethernet.
The data acquisition modules slotted into the cRIO and cDAQ chassis handled the I/O to the customer sensors and actuators. The sensors mostly measured:
- temperature,
- pressure,
- flow,
- power, and
- voltage.
| SOFTWARE FUNCTIONS |
|---|
| Data logging of between 50 and 150 channels and control via digital signals |
| Interface with Excel files for configuration, data logging, and summary calculations |
| SQL database for summary and test setup data |
| Real-time loop for robust operation |
| HARDWARE USED |
|---|
| NI cRIO 8-slot chassis, TSN enabled |
| NI cDAQ 8-slot chassis, TSN enabled |
| Various NI cSeries signal conditioning modules |
Custom Automated Test System – Characterization of Heat Transfer System Thermal Performance
Custom Automated Test System – Characterization of Heat Transfer System Thermal Performance
R&D testing required flexibility in control schemes and measurement I/O
Client – ATSI, a large-scale System Engineering Provider
Challenge
Our client, ATSI, Inc., headquartered in Amherst NY, designs and builds complex structures and process systems, from industrial construction projects to mechanical systems for power engineering. A previous, long-standing Viewpoint customer that does research and design of thermal energy systems approached ATSI to engage in the build of a specialized test skid that would be used to assess and characterize a heat transfer system. Our long-standing end-customer requested a data acquisition subsystem based on LabVIEW.
Furthermore, the end-customer requested a subsystem that supported flexibility in the data acquisition by channel count and type, since the R&D nature necessitated adaptability. The overall test system needed to automate progress through a sequence of setpoints and ramps.
Solution
ATSI designed the automated control and sequencing with a Modicon PLC. Viewpoint augmented ATSI’s engineering resources to provide the data acquisition subsystem and setpoint sequence editing. This sequence was passed to the PLC for automated sequencing thought the setpoint list. Because our mutual end-customer did not provide explicit design details about the hardware needed for data collection and control, we had flexibility to decide which aspects of these needs would be automated by the Modicon PLC and which by the PC running LabVIEW.
Since Viewpoint had previously developed a similar application for our mutual end-customer, with some of the required data acquisition needs, we chose to leverage and enhance that software platform for this project. That choice drove some of the other designs and defined the scope of work for Viewpoint and ATSI. Specifically, we worked with ATSI to select NI hardware appropriate for sampling all the high-speed data, since the PLC would not be capable, and some of the slower speed data, which needed some specific signal conditioning. Other very-slowly changing process parameters were read from PLC tags.
Some overall design decisions were:
- The LabVIEW application provided data acquisition, test configuration, and operator screens.
- The Modicon-based subsystems provided process control and safety.
- A PLC HMI for process system operation and status as well as control loop tuning.
- NI Compact DAQ (cDAQ) offered flexible PC-based acquisition channels for high sample rate historical data collection.
- A sequence editor on the PC defined the test setpoints, durations, and limits to pass to the PLC for execution.
The test configuration encompassed cDAQ channel configuration, PLC tag configuration, sequence editing, and graphical views on the acquired data. Some channels were acquired at slow rates, e.g., up to about 1 S/s for sensors measuring parameters such as temperature and flow, while others had fast rates, e.g., 1 kS/s to 10s of kS/s for sensors measuring parameters such as transient pressure and vibration. Handling the datafile storage and display of this wide range of data types and rates was important for the end-customer to compare and correlate the effects of changing operating conditions.
Data logging is configured by the sequence editor to occur on certain conditions such as immediately entering a new step, time delayed after entering a step, and activated by the PLC upon reaching stable setpoint control. This flexibility gave the end-customer management of when data collection occurred to ease the comparison and correlation of readings from selected sensors.
After the configuration is completed, the sequence is passed to the PLC. The operator starts the test on the PLC HMI and the PLC automates the test run. Data collected during the test run could be displayed in live graphs during testing, used for verification of setup and operation; post-test in stacked graphs and overlaid plots; and exported for specialized analysis, display, and review.
Benefits
The design of this system was driven largely by the need for flexibility. Sensors and channels could be added, the test sequence could be edited with a variable number of steps with editable execution features, and the data acquisition and storage permitted various rates and logging criteria.
These design choices offered the following advantages:
- As a partner of the team, Viewpoint acted as staff augmentation for ATSI by providing experienced engineers with expert LabVIEW and data acquisition capabilities.
- Flexibility of test sequences, including setpoints and their stabilization criteria.
- Tight integration between the Modicon PLC and LabVIEW-based PC enables critical control and safety to execute reliably and yet adjustably.
- Customized mechanical all-welded skid plugs into end-customer’s test article.
- Setup of data logging including configurable sample rates.
- Ability to add channels by plugging in supplemental DAQmx-based cDAQ modules.
- The LabVIEW application architecture is actor-based for straightforward inclusion of new data sources as needed in the future.
- New data sources are registered with the object-based data aggregator.
- The system handles multiple days of test execution
- The multi-pronged viewer allows verification checks while in setup an operation as well as post-test review.
System Overview
The custom automated test system supplied to the end-customer was a hybrid, made up of PC-based and PLC-based components coupled with the fluid-handling components on the skid. The hardware listed below includes only the data acquisition, control, and safety items, and only a high-level description of the mechanical aspects.
| SOFTWARE FUNCTIONS |
|---|
| NI LabVIEW for Windows [Viewpoint] |
| NI LabVIEW Modbus driver [Viewpoint] |
| NI DAQmx hardware drivers [Viewpoint] |
| Actor-based object-oriented LabVIEW application for the PC [Viewpoint] |
| Modicon Concept software [ATSI] |
| Blue Open Studio HMI software [ATSI] |
| Function Block Programming for the PLC [ATSI] |
| HARDWARE USED |
|---|
| Modicon PLC and modules for pressure, temperature, flow and other process variables |
| NI Compact DAQ chassis and modules, e.g., 4-20 mA, RTD, thermocouple, thermistor, and 200 kS/s analog input |
| 600 VDC Power supplies |
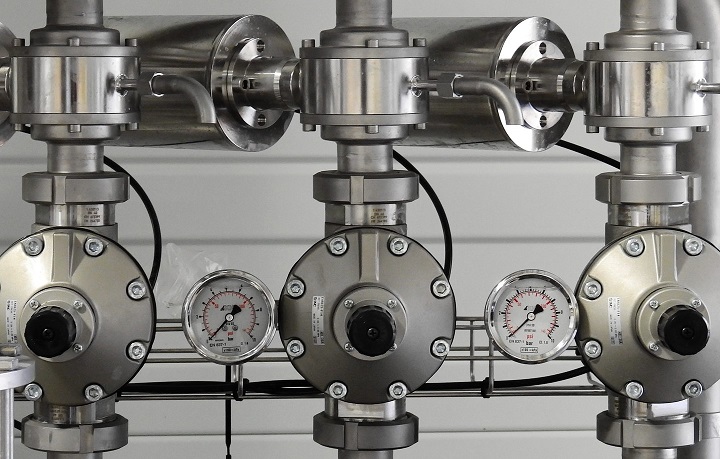
| Components to flow fluid, including pumps, valves, pressure regulators |
| Intel Tower PC for LabVIEW |
| Mini Industrial PC for HMI |
Replacing Wire-wrap Boards with Software, FPGAs, and Custom Signal Conditioning
Replacing Wire-wrap Boards with Software, FPGAs, and Custom Signal Conditioning
Electronic components of fielded systems were aging out
Reverse engineering effort converted wire wrap boards to FPGA-based I/O
Client – Amentum – A supplier for Military Range System Support
Challenge
Amentum (www.amentum.com) supports a decades-old system deployed in the early 1980s. While the mechanical subsystems were still functioning, the wire-wrapped discrete logic and analog circuitry was having intermittent problems.
Systems designed and built decades ago can sometimes have wonderful documentation packets. Nevertheless, we’ve been burned too often when the docs don’t incorporate the latest redlines, last-minute changes, or other updates.
The replacement system needed to be a form-fit-function replacement to land in the same mounting locations as the original equipment with the same behavior and connections. Below is an image of the existing wire-wrap boards and their enclosure. We had to fit the new equipment in this same spot.
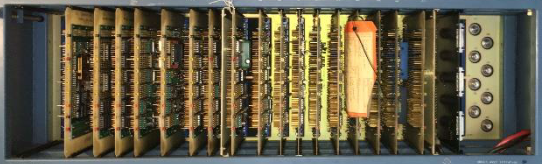
Figure 1 – Original wire-wrap boards
Finally, Amentum wanted to work with Viewpoint in a joint development approach. While our joint capabilities looked complementary, we didn’t know at the start how well we would mesh with our technical expertise and work culture – it turns out we worked extremely well together as a team and neither one alone could have easily delivered the solution.
Solution
Since the team treated the existing documentation package with suspicion, we adopted a “trust but verify” approach. We would use the documents to give overall direction, but we would need details from the signals to verify operation.
Leveraging Amentum’s experience with the fielded systems, the team decided early on to record actual signals to understand the real I/O behavior. We used the system’s “test verification” unit to run the system through some check out procedures normally run prior to system usage. This verification unit enabled us to use a logic analyzer for the I/O to and from the discrete logic digital signals and an oscilloscope and DMM for the analog signals. The available schematics were reviewed to assure that the signals made sense.
With a trustable understanding of system operation, Amentum created a requirements document. We jointly worked on the design of the new system. There were both an “inside” system (in a control shelter) and an “outside” system (in the unit’s pedestal).
Some overall tasks were:
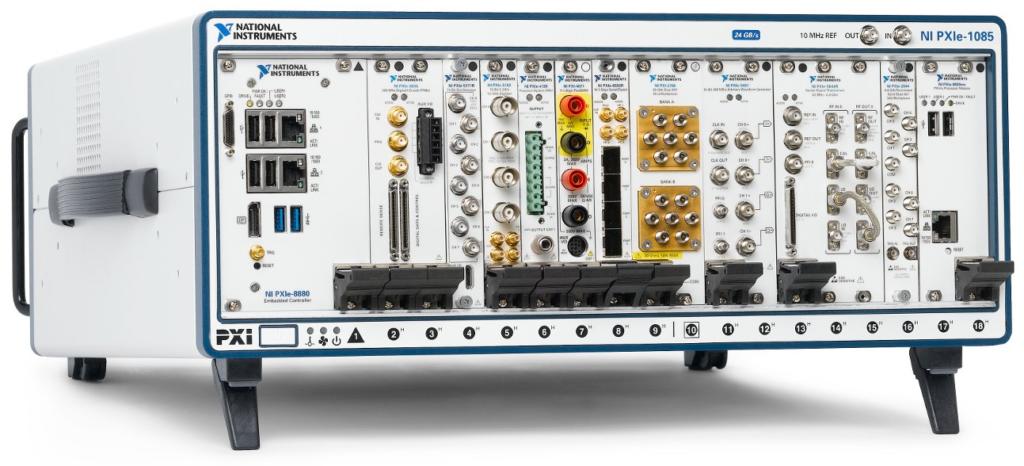
- Viewpoint recommended an architecture for the inside application running on PXIe LabVIEW RT and FPGA layers.
- Amentum created the system control software on a Linux PC.
- Viewpoint developed the more intricate parts of the inside application and mentored Amentum on other parts they developed. This work recreated the existing discrete logic and analog I/O using PXIe NI FPGA boards.
- Viewpoint designed custom interposer boards to connect harnesses to the NI PXIe equipment, including a test point and backplane boards.
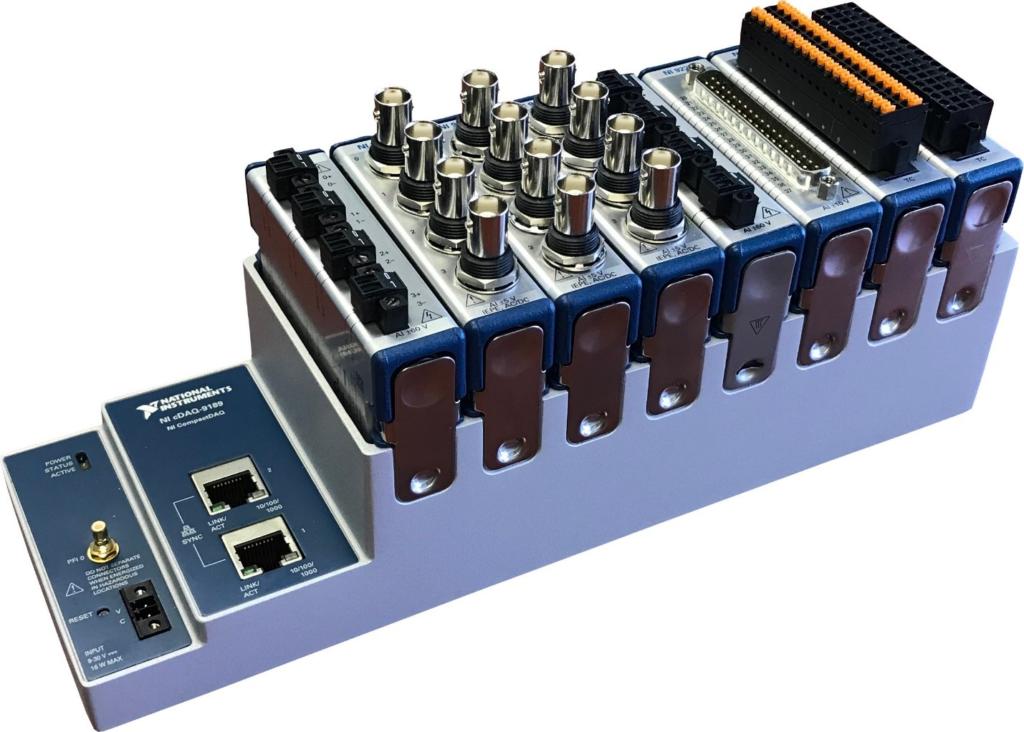
- Amentum designed and developed the cRIO-based outside system application and Viewpoint created a set of custom interposer boards to connect harnesses to the cSeries modules.
Critical to this project was our hardware selection services. By combining our engineering skills for the reverse engineering of the legacy electronics with our knowledge of the NI hardware, we narrowed the hardware choices to a few NI FPGA boards.
These PXIe FPGA boards and cRIO FPGA-backed modules handled the required 60 MHz clock-derived signals with correct phases, polarity, analog inputs, and so on. Furthermore, the wire-wrap boards were register-based so the PXIe had to decode “bus signals” sent over a Thunderbolt bus to emulate the programming and readouts from the various wire-wrap boards.
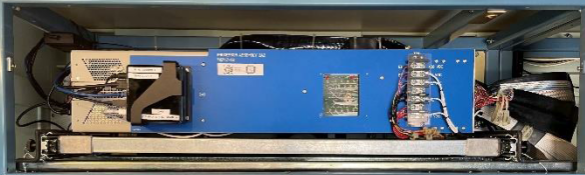
Figure 2 – PXIe replacement to wire-wrap boards
Amentum wanted to be able to support the LabVIEW FPGA VIs used to replace the functionality of the discrete logic. So, Viewpoint acted as mentor and code reviewer with Amentum to ramp them up on using LabVIEW FPGA effectively. Neither one of us alone would have been successful coding the applications in the allotted time. Joint knowledge and experience from both Viewpoint and Amentum were required.
Signal conditioning and harnesses needed to be reworked or replaced as well, of course, since the landing points for the wires were different in the new system. Viewpoint suggested a technique, which we’ve used frequently in past obsolescence upgrade projects, to create PCB boards that accepted existing connectors.
For the cRIO, these interposer “connection” PCBs plugged directly into the cRIO cSeries module. For the PXIe, these interposer PCBs accepted the field wiring connectors and converted them to COTS cables that connected to the PXIe modules. These interposer PCBs could have signal conditioning incorporated as needed. This approach significantly reduced the need for custom harnesses. All told, about 200 signals were passed between the PXIe and various other subsystems, and about 100 for the cRIO. This approach saved significant wiring labor and cost.
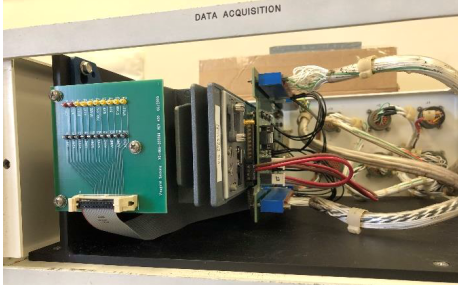
Figure 3 – cRIO with interposer boards between cSeries and field harnesses
The work to design and build the signal conditioning custom electronics was split between Viewpoint and Amentum. Viewpoint did more design than build and handed over the schematics and Gerber files to Amentum so they could manage the builds while also being able to make modifications to the boards as needed.
Benefits
Amentum wanted an engineering firm that was willing to work along side them as a partner. Joint discussions about architecture and design led to a collaborative development effort where Amentum benefited from Viewpoint’s extensive expertise and guidance on LabVIEW architectural implementation and FPGA coding style.
The main outcomes were:
- As a partner of the team, Viewpoint acted as staff augmentation by providing experienced engineers with technical capabilities that Amentum initially lacked.
- This team approach delivered a stronger product to the end-customer more quickly than either of us could do alone.
- The combination of Viewpoint’s and Amentum’s experience reduced the amount of reverse engineering needed due to the lack of firm requirements.
- Reduction of electronics obsolescence by using software-centric FPGA-based functionality. Recompiled LabVIEW FPGA could target future boards models.
- Increased software-based functionality simplifies future updates and modifications.
- Decrease in number of parts leading to simpler maintenance.
- Lower wattage consumed eliminated need for an anticipated HVAC upgrade.
- Cybersecurity concerns were reduced by using Linux-based systems and FPGA coding.
System Overview
Using software to emulate the old hardware was a critical success factor. Since the requirements were not 100% solid at the start of the project, some field-testing was required for final verification and validation. The flexibility of the software approach eased modifications and tweaks as development progressed. A hardware-only solution would have necessitated difficult and costly changes. For example, some of the changes occurred very near the final deployment after the system was finally connected to an actual unit in the field.
| SOFTWARE FUNCTIONS |
|---|
| Emulate original discrete logic functions via FPGAs |
| Emulate original analog signal I/O |
| Overall system control via Linux PC |
| Maintain the same user experience as existed before |
| Modern application architecture for simpler maintenance |
| HARDWARE USED |
|---|
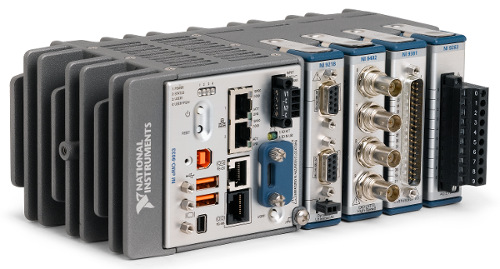
| NI cRIO chassis with various cSeries modules |
| NI PXIe chassis with FPGA modules to handle all the analog and digital I/O via a combination of multifunction and digital-only cards |
| Custom PCBs for signal conditioning and connectivity |

Enhanced Portable Data Acquisition and Data Storage System
Enhanced Portable Data Acquisition and Data Storage System
Using a Real-Time Operating System (RTOS) provides a high level of synchronization and determinism for acquired data.

Client
Tier 1 Automotive Design and Manufacturing Supplier
Challenge
Our client had an existing data acquisition system, used for mechanical product validation testing, that had undergone many updates and patches for over 15 years. These updates and patches, performed by multiple developers, had rendered the software portion of the system somewhat unstable. Furthermore, the system hardware was based on NI SCXI, which was becoming obsolete. These issues prompted our client to migrate to an entirely new system.
New requirements for this upgrade included utilizing a PXI controller running NI Linux Real-Time, a RTOS, executing a LabVIEW RT application. Selection of the replacement NI hardware required knowledgeable engineering to assure compatibility between the selected NI hardware and the legacy SCXI equipment. Part of that compatibility assessment included an understanding of the software application so we could know for certain how the SCXI equipment was used. A blind selection based entirely on hardware specs would have missed nuance, such as the need for synchronized acquisition.
The data acquisition software had to support a variable mix of signal conditioning modules in the PXI chassis. In addition, the data acquired from these signal conditioning modules needed to be synchronized within microseconds.
Solution
Viewpoint leveraged another application, developed for the client a few years prior, to harmonize the user interface and to reduce development effort. Most of the development time focused on support and configuration of the multiple module types and ensuring that the data synchronization functioned as required. The result was an ultra-flexible, portable, high-speed data acquisition software/hardware combination that can be used to acquire time-sensitive, synchronized data across multiple modules in a PXI chassis running a real-time operating system.
Benefits
The upgraded system offers the following features:
- Highly configurable real-time data acquisition hardware/software solution based on LabVIEW RT and PXI hardware. Our client works closely with OEMs to assure compatibility and durability with their products, often going to the OEM’s test cells to collect performance data. The configurability in modules and channels affords the fastest possible setup at the OEM’s site which minimizes time and cost in the test cell.
- Configuration files stored in a SQL database format. Saving channel and module setups in SQL allows the test engineer to locate previous hardware and data acquisition configurations. The usual alternative is a bulk save of an entire system setup rather than using a more granular, and hence, more flexible approach afforded by using the database.
- Immediate test feedback through graphs and analog indicators, used to assure data quality before leaving the test cell.
- Data playback features after the data has been acquired, used for in-depth review of data after leaving the test cell.
- Data acquisition on the RTOS provides assurance that the acquisition will not be interrupted by network or other OS activities, which was occasionally an issue with the prior Windows-based application.
- Synchronization between signal conditioning modules ensures time-critical data taken on separate modules can be compared and analyzed.
System Overview
The system consisted of custom LabVIEW RT software intended to run on an engineer’s laptop and the PXI real-time controller and a PXI chassis populated with a flexible assortment of NI signal conditioning modules (provided by the client).
The software used an object-oriented Actor-based architecture, which facilitates adding new signal conditioning modules and flexible communications between the host PC and the real-time controller.
| SOFTWARE FUNCTIONS |
|---|
| DAQ Task Configuration |
| Event-Based DAQ Trigger |
| Data Synchronization |
| Real-Time Data Visualization |
| Data File Playback Utility |
| Datalogging to TDMS File |
| HARDWARE USED |
|---|
| PXIe Chassis (4,9 or 18-Slot) |
| PXI Real-Time Controller |
| PXI Multifunction I/O Module |
| PXI Digital I/O Module |
| PXI Counter/Timer Module |
| PXI Thermocouple Module |
| PXI DSA Module |
| PXI LVDT Module |
| PXI High-Speed Bridge Module |
| PXI Voltage Input Module |
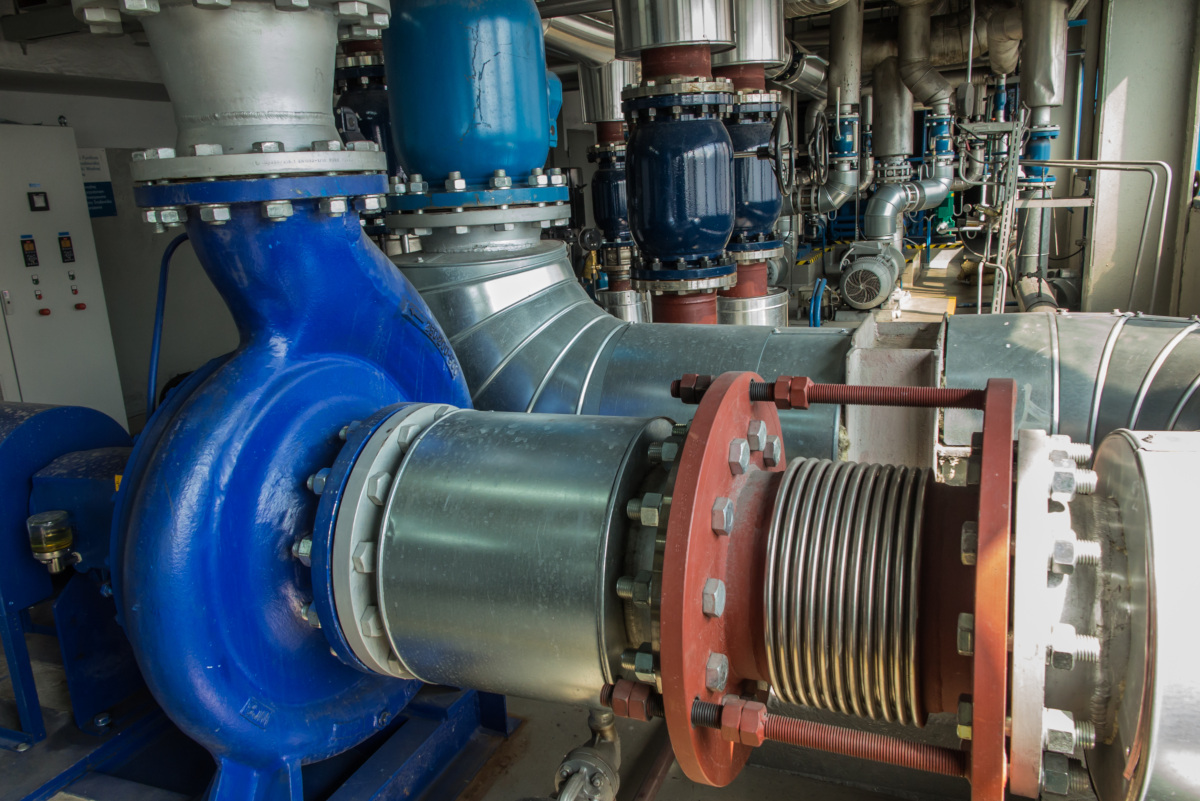
Pump Test Station
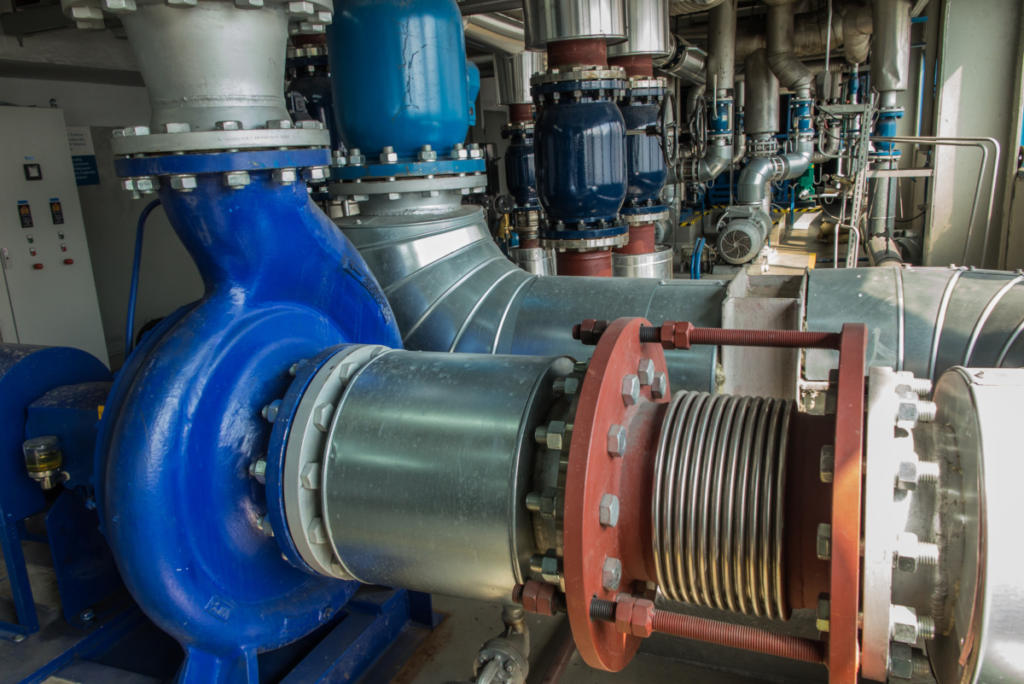
Pump Test Station
Client – Industrial pump manufacturer
Standardizing on testing technique & reporting
Reducing the number of pumps in the production queue
Challenge
Pump manufacturers typically test their product in the same facility in which the pumps are created. These tests are well defined and based on standards created by organizations such as API and ANSI to name a few. These tests are run to verify the performance of the pump as well as provide a report to the customer demonstrating that the pump they purchased will meet their needs. Sometimes these tests become factory witness tests where the customer sits in on the testing being performed on the pumps they had purchased.
Most pump manufacturers have more than one testing site at a facility to accommodate different pump types and sizes. The ability to automate these tests and to present a common look to the testing process and reports make the customer experience more positive to those reading the reports and/or witness the testing.
Our client came to us with the following requests:
- Evaluate the software written by the previous integrator to assess whether any of the code could be reused in the new application.
- Specify a hardware and software solution to acquire the signals needed to compute the performance results for standard tests. We made recommendations and selected appropriate hardware based on comments from our client about desiring compatibility between their test stands around the world.
- Deploy the hardware/software solution on the first test site to verify it performs as required and then deploy to the remaining test sites at their facility.
Solution
The Pump Test Utility had the following features:
- A Pump Test application that can run one of two different tests; a performance test and a net positive suction head (NPSH) test.
- An Access database was used to store the available sensors for that test site. The user selected the appropriate sensors while configuring the test.
- The test data was stored in an Excel file where each pump received its own Excel file.
- The LabVIEW Report Generation toolkit was used to populate the Excel file with data as well as create the report for the pump
Benefits
- Standardization of testing technique – now each pump will be tested with the same procedures and calculations/algorithms used are standardized across all test sites within the facility.
- Standardization of report content and presentation – now every customer that purchases a pump from our client will receive a report with identical information presented and that information will have been derived from the same calculations/algorithms.
- Reduction of the number of pumps in the production queue (and hence inventory) by roughly as much as 1/2 due to faster data acquisition and especially the archiving of the test results and the generation of the final report and its associated calculations.
System Overview
We developed the Pump Test Utility application to allow our client’s engineers and operators to:
- Run one of two guided tests that visually provides pump performance feedback during the test.
- Create a test configuration file based on an Excel template that will be used to store test data as well as generate a report.
The pump test software was developed in LabVIEW and interfaced with an Access database and Excel workbook to acquire the configuration information necessary to set up and run the required tests. The resulting data acquired during the test, both raw data acquired from the sensors and calculated data used to characterize the pump being tested, are saved to the Excel workbook. Both high speed (10 kS/s) and low speed (10 S/s) data are acquired and stored into one data file for archival storage and retrieval if additional analysis is required. The high-speed data are for vibration and sound measurements and low speed data are for pressure, temperature, RPM and flowrate measurements.
The pump test configuration is performed within the application from a series of drop down selections populated with sensors found in an Access database. The database is updated and maintained by the client through a series of user interfaces within the application. Once the test sensors and conditions have been selected, those selections are written to the Excel workbook for use in the reports.
The LabVIEW Report Generation Toolkit software was used to develop the reports the client provided to their customers. The Excel workbook template contained the formatting necessary for the reports. As the software wrote the data into the workbook, the reports were built from the formulas and formatting already configured in the Excel template. At the end of the test, the software printed the appropriate worksheets containing the elements of the report required.
| SOFTWARE FUNCTIONS |
|---|
| Data Acquisition |
| Test Sequencing |
| Metric or SAE Units |
| Multi-Level User Authentication |
| 2 Standardized Test Types |
| Generate Standard Table-Based Reports |
| Generate Pump Performance Graphs |
| Generate Vibration Graphs |
| Sensor Management Tools |
| Test Configuration Management Tools |
| HARDWARE USED |
|---|
| NI cDAQ Signal Conditioning Chassis |
| Variety of NI cSeries Signal Conditioning Modules |
| Pressure Sensors |
| Flowmeters |
| Vibration Sensors |
| Displacement Sensors |
| Temperature Sensors |
| Torque Sensors |
| Speed Sensors |

Industrial Monitoring for a Harsh Environment
Industrial Monitoring for a Harsh Environment
Developing an industrial monitoring system for ultrasound-based sensing in a harsh environment
Client – Energy Research Lab
Challenge
Our client was experiencing problems making temperature measurements in a hostile, irradiated environment. Traditional temperature sensors don’t last long in this environment, so our client was developing a sensor designed for these conditions.
Special equipment is required to drive this sensor. It’s an active sensor requiring an ultrasound pulser/receiver (P/R) and high-speed digitizer to make it function.
The prior attempt the client made at using an original set of special equipment was having reliability and connectivity issues. This reduced reliability was of critical concern due to the requirement for the sensor to operate for years without downtime.
In addition, the existing application was incapable of displaying live data and lacked a user-friendly interface. On top of that, data analysis had to be done after the application was run, causing delays.
Our client needed reliable and robust hardware to drive the sensors and an application that would eliminate the challenges associated with the existing system.
Solution
Viewpoint accomplished the following:
- Evaluated two different ultrasonic P/R sensor driver hardware solutions to select a solution that would provide the connectivity robustness, configurability, and correct sensor driver characteristics required for the given sensors.
- Decoupled the digitizer embedded in the original P/R by adding a PXI digitizer with better capability.
- Provided backward compatibility with previous measurement hardware to aid in performance comparisons with the new hardware.
- Developed a LabVIEW-based application that corrected all the issues with the existing application including real-time data analysis, real-time data visibility and a modern user interface. The new application also provided sensor performance traceability using the sensor’s serial number.
We selected the NI hardware and non-NI equipment to assure compatibility.
Benefits
The enhanced measurement system offers the following benefits:
- Reliable sensor subsystem to ensure uninterrupted data acquisition.
- Measurement hardware configurability for sample rate, collection duration, and pulsing repetition rate.
- Application configurability for automating the analysis, historical archiving, and results reporting.
- Real-time data analysis.
- Sensor traceability through serial number and data files.
- Engineering mode to take control of the entire measurement system.
- Improved data logging to include raw and analyzed data.
- Improved application user experience via robust data collection and configurability.
System Overview
The deployed temperature monitoring system consisted of the following components:
- COTS pulser/receiver hardware for driving the sensors.
- COTS high-speed DAQ for retrieving ultrasound signals.
- A LabVIEW-based software application to provide real time data monitoring, error/alarm notification, data analysis, data logging, part traceability and backward compatibility with the older sensor driver hardware.
| SOFTWARE FUNCTIONS |
|---|
| Acquire Data from Sensor Driver Device |
| Data Analysis |
| Write Raw Data to File |
| Write Analyzed Data to File |
| Configuration Utility |
| HARDWARE UTILIZED |
|---|
| Sensor Pulser/Receiver Driver |
| NI PXIe Expansion Chassis |
| NI PXI Oscilloscope Module |
| NI PXI Thunderbolt 3 Module |
| INTERFACES / PROTOCOLS |
|---|
| RS-232 |
| Thunderbolt 3 |
Custom Endurance Test System – for a medical device
Custom Endurance Test System – for a medical device
Increased level of automation allows for multi-day and multi-week test runs
Client
A medical device manufacturer
Challenge
Our client wanted to improve the endurance testing of an implantable medical device product to help determine the recommended lifetime of the product. An obsolete test system existed, but the client wanted improved performance, UX and configurability. They wanted to just hit the “go” button and let it run for days or weeks. They also needed to be able to have new features added after the first release.
Solution
The custom product validation endurance test system utilizes NI cDAQ off-the-shelf hardware combined with custom LabVIEW-based software to provide automated N-up endurance testing of the UUT. The specific NI hardware selection was driven by both capabilities and physical space requirements. We suggested cDAQ to our client because of its small physical footprint (we connected it to a somewhat remote PC) and ability to expand into other future endurance testing needs by swapping out modules as needed.
Benefits
- Higher fidelity DAQ
- Increased configurability of the system to run tests the way the client wants to
- Increased level of automation allows for multi-day and multi-week test runs.
System Overview
The endurance tester physically stresses the UUT to measure force and eventually breakage events. These events are used to help determine the recommended lifetime of the product. The tester tests multiple UUTs in parallel in order to gather more data faster for statistical validity. The system collects data until all UUTs break or the operator stops the test.
Viewpoint provided the software and advised DAQ hardware selection. The rest of the test system hardware was selected and assembled by the client.
The automated test system applies a varying cyclical force to multiple UUTs while measuring the force applied to the device. The software automates the data acquisition, analysis, load application, and motor during a test. The system measures all forces applied simultaneously while synchronizing that data to a cycle counter. That data is analyzed to determine average, maximum, and minimum force applied to the device over a user configurable number of cycles.
While running there are multiple alarm states that are monitored. When these alarm states occur, a file can be generated to dump a user configurable duration of force measurements to a file. Other alarms generated trigger the system to change a digital output state triggering a text message to be sent to the operators of the system. The system was designed to test for weeks at a time.
| SOFTWARE FUNCTIONS |
|---|
| Test Sequencer |
| UI |
| Data Logging |
| Report Generation |
| Breakage Event Detection |
| HARDWARE USED |
|---|
| NI cDAQ |
| Multiple NI load cell cSeries modules |
| NI cSeries Digital Input module |
| NI cSeries Digital Output module |
FAQ
How long have you been designing and building test, measurement, and control systems?
Since 1993
How many systems have you delivered?
Over 2000.
Are you familiar with vendors other than NI?
Yes. Examples of some other primary vendors are: Keysight, Textronix, Keithley, Kepco, Acopian, Pickering, Digi-Key, Mouser. We also choose products from some specialized vendors that supply systems used for product and material testing, such as MTS Systems and Applied Test Systems.
Do you charge for this consultation?
No, we simply ask that you purchase the equipment through us.
Why would you do this? What’s in it for you?
As the complexity and breadth of NI’s offerings have grown, we decided to offer a service for those engineers that want to build the system themselves. In those situations, we could have people buy the hardware through us, allowing us to make some additional revenue while expanding our customer base.
Plus, normally, we have a chance to introduce ourselves to you only if you were considering our system integration services. We like meeting and helping new clients. And helping you select test hardware would give us a chance to build on these new relationships. You might even want to engage with us on a system integration project in the future, where we’d take on all or part of the design and build effort.
Basically, we believe this will lead to opportunities to help new clients (and give us a little revenue boost along the way).
When doesn’t it make sense for you to help me?
After designing and building test systems for decades, we’ve seen a lot, but we’re not experts in every type of measurement. For example, we don’t have much experience with RADAR and RF testing, exotic equipment like femtosecond pulsed lasers, or PLCs.
If we feel like what you need is outside our expertise, we’ll tell you and then figure out if there is some other company or person that we know of who can help you.
We aim to please, whether you work with us or not.
We’ve helped teams at some of the world’s most innovative companies