
Building a Business Case for Automated Manufacturing Test
Not sure if it’s worth the cost to build an automated test system (ATS) for your manufacturing department?
This white paper reviews the cost drivers of ATS development and introduces a financial model that calculates cost effectiveness across multiple areas of the company. Key topics covered include:
- Motivations for using automated testing
- Impact of an ATS across the organization
- Development and operational costs of an ATS
- ATS financial model and equation
- Analysis of a real-world example
Introduction
Many companies choose to build an automated test system (ATS) based on the specifications of the product being tested. However, they often don’t analyze the cost-benefits tradeoffs of the ATS and even more frequently miss wider opportunities to leverage test systems by understanding the greater effect on the rest of the company.
This white paper reviews the cost drivers of ATS development and the impacts the test system has on different areas of company beyond the localized manufacturing station. Specifically, we will introduce a financial model that can be used to calculate the cost effectiveness of various test system design options against several variables throughout the company, such as product or subassembly selection, rework, returns, test data usage, and other factors. This model helps answer the question “How can we maximize our testing dollars” when designing and building a test system.
Key topics covered in this article include:
- Motivations and financial considerations for using automated testing in manufacturing
- Cost drivers for ATS development
- A financial model with an example derived from real-world analysis of an actual company
Business Case Drivers
In this first section, we describe some typical motivations for using ATSs in manufacturing. While these motivations may be obvious, there are two main reasons for listing them. First, the important factors for using a test system are clearly established for the purposes of this discussion. Second, this list will later be used build the financial model at the end of the white paper.
Reasons to Test
Managers and engineers in the manufacturing industry may have different reasons for utilizing an ATS, such as:
- Improving product quality
- Minimizing production time
- Decreasing manual testing errors
- Reducing rework or scrap
- Improving repeatability and reproducibility
- Reducing labor costs
- Reducing liability
- Hastening access of test results
- Enhancing safety of people and property
Some of these items are directly associated with the product while others are operational in nature. Others motivations may apply to your particular situation.
Furthermore, with every passing year, components grow more complex to design and build while performance specifications grow even more demanding. These features increase the cost of developing and building an ATS. In fact, one study in the International Technology Roadmap for Semiconductors (ITRS) from the Winter 2002 Conference indicated that test can be more than 30% of manufacturing cost for some for electronics components.
Department Differences
ATSs impact different departments within a company in various ways. Often, it is important to involve stakeholders across the company. Below is a list of possible stakeholders and the motivations/benefits an ATS may provide them:.
- Manufacturing: Produce as many units as possible.
- Quality: Don’t ship the bad units.
- Design: Use the test results to improve robust design.
- IT: Manage the resulting test data.
- Marketing & Sales: Be able to guarantee the products are robust, high-quality, and safe.
- Legal: Avoid warranty and liability claims.
- Corporate: Ship many good, robust, and high-quality units at the lowest possible cost.
Balancing and prioritizing all these motivations is just as important as choosing the proper measurement equipment. For example, if the design department can show that analyzing the test results will lead to an improved next generation design, the entire company may be able to increase the overall profit margins of a product simply be making the test data readily available. A financial analysis can help assess whether the additional incremental costs of easing access to test data can be heavily offset by manufacturing cost reductions based on a new design.
Cost Considerations
Making an assessment on automated test options starts with an understanding of:
- The costs associated with the development of the ATS
- The costs of producing the units and managing the components of the company connected to the use of the test system
These costs are required for the financial model presented here. The goal of using the financial model is to compare the cost of development of the ATS against the costs of operating the ATS.
Several development and operational scenarios should be considered. Typically at least two scenarios are considered: 1) keeping the status quo versus 2) implementing an ATS. Often this second scenario is further analyzed in terms of using 2a) an ATS with basic capabilities versus 2b) one with extended capabilities. Despite the additional development costs often associated with scenario 2b, this choice can offer more cost reduction in the long term than 2a. The example presented in this white paper will seek to demonstrate this premise.
An important intangible aspect of gathering the costs for the financial model stems from the exercise itself: a better understanding of the costs can often lead to an improved view of the operation of the company.
ATS Development Costs
The cost to develop the ATS is obviously dependent on many attributes, such as the testing requirements, availability of any appropriate tools and designs, measurement hardware needs, and so on. Determining these costs takes experience. Yet, for the purposes of the financial model, estimates are acceptable for steering decisions toward the best overall solution.
The ATS development cost is fixed and based on the time spent designing, building and deploying the system. This non-recurring engineering (NRE) cost is mainly comprised of labor rates and equipment. At a minimum, you should include proportioned salaries for the following personnel: design engineering, test engineering, test operators, test management, and quality. Labor rates should encompass all costs, including base salary, bonuses, health care, and other personnel costs.
ATS Operating Costs
The ATS has an operational lifetime which is bounded either by the test equipment or the lifecycle of the product(s) being tested.
Unlike the NRE cost, operational costs are perhaps best estimated on a per unit tested basis. These variable costs are associated with the number of parts being tested per unit time. Items that degrade during use are commonly included, according to the specifics of the part being tested. These may include:
- Connectors and wear cables
- Fixturing
- Part nests
- Thermal chamber operation
- Floor space usage and utilities (power and HVAC)
- Periodic maintenance
Don’t forget that “maintenance” implies more than just hardware maintenance. Tests change over time, leading to changes in software and perhaps hardware. These test changes arise via product design revisions or the addition and removal of test steps as needed for better correlation with product field failures. A good rule of thumb is that on-going upgrade maintenance costs can be between 0% and 10% of the initial NRE cost per year.
For operational time lines longer than five years, pay attention to any major upgrades to development software and operating systems as well as hardware replacement and obsolescence upgrades. Such obsolescence costs can be equivalent to the initial NRE cost.
Company Cost Factors
These costs are grouped into three main sources:
- The cost of developing and maintaining the test system
- The per-unit costs of operating the test system
- The per-unit costs of handling any product failed by the test system
This third source includes rework, scrap, field returns, and, perhaps most importantly, the potential lost revenue and insurance claims caused by customer perception from a poor product.
Automated Manufacturing Test Model
Major Components
The previous sections described motivations and outcomes for using an ATS. We consider the ATS as a box with inputs and outputs connected to the rest of the company. A system diagram model emerges with some specific major components for handling a part as it flows through the company, where the product to be tested enters on one side and exits on the other. This approach has been followed before at the University of Texas at Austin. However, based on past experience, we have distilled the model to a manageable and reasonable level.
The system diagram model presented here allows us to assign costs to the various operations performed and material used in handling the product as it moves through the system. These costs depend either on the amount of time it takes to perform an operation or the cost of the consumables per tested unit. For example, if the test operator takes X minutes to prepare the unit for the test, the cost of this operation will be operator rate times the duration.
As another example of per unit costs, suppose the test requires the unit to be place in a heater. Then the cost of the per-unit consumables used in this operation will include the cost to operate the heater (i.e., electricity cost). Because the heater will break eventually, we must include the replacement cost of the heater averaged over the number of cycles it will operate during its lifetime.
Often, companies have difficulty in determining the various costs in the system diagram model. In fact, a practical outcome of analyzing this model is a greater appreciation and understanding of the manufacturing process.
Initial Handling and Testing
The flow of a product through a test system starts with part handling as it arrives at the ATS. The unit will need to be connected to the ATS and there may be some consumable components associated with running the test. Thus, performing the test has an associated per unit cost due to the time the operator takes to connect the unit and waits for the test to complete, as well as any consumables used during the test, such as electrical power, hydraulic fluid, coolant, and so on.
Rework
A simplistic model might be complete at this point, but consider second order effects such as rework for any parts that fail. These parts go through a sort of feedback loop where the part needs to be diagnosed for the reason of failure and then possibly reworked to be fed back into the usual test flow. We will need to know:
- How many units fail per unit produced on average (the failure rate)
- How many average minutes and consumables the diagnosis procedure requires
- What percent of these units are irreparable so that that unit’s production costs are lost forever
Returns
Every company strives for zero returns. However, customers do return units that initially passed all the ATS tests. . The model will need the fraction of units returned under warranty per unit shipped since each will need to be repaired and retested or cause a new unit to be built to replace the defective one.
Each return can incur a handling cost that has both a baseline cost component and a time-sensitive diagnostic component. Furthermore, reviewing the results of diagnostics testing on returned units will help categorize most common causes and suggest either more stringent testing criteria or a new design or both for future units. Managing and utilizing the data on these returned units can lead to improved customer satisfaction due to lower return rates.
Test Data Storage
The data collected from each tested and returned unit can be archived for further analysis, such as by Statistical Process Control (SPC), which aids in reducing production defect rates and assisting the design teams with performance data across many more devices than could be validated during the design phase.
Data is typically stored in files (raw data) and in a database (summary data) that reside on a central server. The upkeep and backups of data as well as the generation of reports costs the IT department money and time. The model will need the cost per unit produced for support of test data.
Model Diagram and Equations
Overview
Figure 1 summarizes the components in the previous section. The label for each block contains a variable which appears in a cost estimate formula. The unit of measure for the variables is cost per unit.
The variables are related to several factors, such as:
- The time that a resource is involved with handing the product, and is best computed from the labor rates of the various personnel
- Material costs from consumables used to test the product or parts needed to repair
- The above costs combined into a single number, since both labor and material are involved
For example, suppose the part being tested is a hydraulic pump. Then the cost of handling the part in preparation for the test will include the material cost of the hydraulic fluid used to prime the pump (a consumable material cost) and the time the operator takes to connect the pump fittings to the test fixture (a labor cost).
Often the consumable material costs are spread over many parts. For example, the hydraulic fluid would be reused several times with the pump under test being drained after the test, or the cable connecting to the electronic board being replaced after testing 100 boards.
Regardless, all costs should be formed on the basis of the cost to perform the operation on a single unit.
Consider that the test operator rate includes direct wages, indirect overhead costs to operate the test equipment, and any material costs consumed during testing a single part. Likewise, the average cost for warranty handling includes labor rates for those personnel and any material involved in repair or scrapping.
Finally, some parameters in this model are probabilities. For example, only a fraction of tested parts will fail and need to enter the rework flow. That fraction is measured as a probability that parts will be returned to the ATS for further testing. These probabilities have values between 0 and 1.
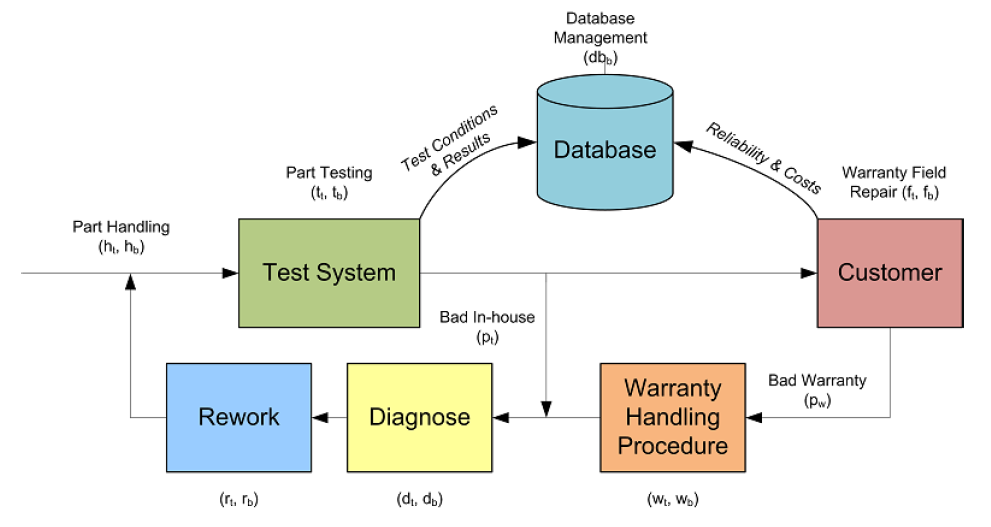
Figure 1 – Model of part flow through the company showing connections to the test system
The estimating equation is shown next.
C = T+pt*(R+T)+S+pf*F+pw*(W+R+T)+D, (Eq. 1)
where the per unit cost parameters are:
C = total cost per unit,
T = h+t ,
where h = part handling and t = part testing,
R = d+r,
where d = failed part diagnosis and r = failed part rework,
S = scrap from rejected parts,
D = database management,
W = warranty handing,
F = field repair,
pt = probability of test failure,
pf = probability of field repair,
pw = probability of warranty handling.
This equation assumes second order costs are negligible, such as happens when a part that failed once already fails the test again and needs to be reworked once more.
Note that we have treated the per-unit cost of scrapping but only simplistically, since rework can have a complicated cost structure. For example, some failure modes may need diagnosis to determine if they can be reworked or scrapped and other failure modes may lead directly to scrapping. In addition, a scrapped part may have salvable components.
Real-World Example
Background
This section reviews an actual project which began with expectations for building a test system for one product with highest production volume and ended with utilizing a test system designed to handle multiple product models.
This outcome is not uncommon. Companies have a market niche and many of their products within a single line all have the same basic functionality: the products have a range of specifications and yet all look similar to the ATS.
The particular product line analyzed in this example had multiple versions, each with different output ranges. When a test system expands its testing capability to encompass a product line rather than just one product, the incremental cost of adding a few additional features to the ATS can be spread across a higher production volume. Any NRE design and development time is then at a reduced per unit cost.
The numbers used in this example are actual but the company name is withheld for privacy reasons.
Analysis for One Product
Initially, only a single product – Product A – was considered for testing and was chosen because it was the highest volume product.
The company had detailed work instructions for testing Product A via manual testing. The model in Eq. 1 was analyzed for this manual testing and parameter values were determined by the manufacturer to be as follows.
h = 12.5,
t = 25 (includes time for operator to run test and engineering to review results),
d = 0 (test results directly indicated required repairs),
r = 120,
S = 0 (all parts are reworked),
D = 0,
W = 800,
F = 0,
pt = 0.2 (actually 20% due to manual tuning steps rather than poor manufacturing),
pf = 0,
pw = 0.
Then, C = $69 per unit. Note that costs associated with field repair, warranty handling, and database management were neglected.
ATS Cost Estimate
Based on the requirements for testing this product, the cost of designing and building the ATS was estimated to be:
- $6200 for the test station, including the material cost of the hardware and software components and the labor cost to build the test rack.
- $31000 for NRE (non-recurring engineering) to design the test rack, develop the software, test and debug the system, train the operators and engineers, and provide documentation.
Note that this system was deployed with a test executive application which allowed the manufacturing engineers to create new test steps and edit existing ones. The engineers requested training on the test executive tool, and that cost is bundled into the NRE.
Analysis for One Product Using ATS
With this ATS in place, we estimated the following parameter changes.
t = 2.5.
Then, C = $42 per unit.
Cost Analysis
The cost savings of having a test station were estimated to be $27 per unit. With an annual unit volume for Product A of 180, the savings are $4860 per year. The cost of the ATS was estimated at $37200. Thus, payback on the test automation was about 7.7 years, an unacceptably long time.
Certainly, there are intangibles in having a test system that are hard to quantify financially, such as improved test reporting to help analyze most prominent failure modes leading to a better design or manufacturing procedure. However, management thought this payback time was unsatisfactory.
Analysis for Multiple Products
Since the manufacturing company made several similar product models, we reviewed the cost increment of supporting additional product models. Since these additional models could be tested with the same test hardware as needed for Product A, the modifications to the ATS were limited to additional test procedures, easily accommodated by developing new test steps. The additional cost was estimated to be $10000 to develop the new step types and $2000 per product model to create a model-specific test sequence and association test limits. These appended products were then analyzed by using Eq. 1. Cost savings across the various product models were determined to range from around $27 to $35 per unit with product volumes ranging from 180/year (for Product A which was originally thought to have a sufficient payback) to 36/year on the low end.
Averaging all the costs associated with the extra product models produced an annual savings when using the ATS of $27000/year while increasing the ATS development cost by $34000 to $71200. The payback was then 2.6 years, which was deemed acceptable by management.
Comments
- This approach worked because the ATS was not fully utilized with the one “high-volume” Product A so that the additional product models could be tested with one ATS. If an additional ATS were needed to accommodate all the product test time, then the cost for an additional ATS would have been roughly $10200, which includes $6200 for the ATS equipment (see above) plus a setup time and effort of about $4000. Including this nominal amount, the payback time would have increased only about 0.5 years for double the manufacturing test volume.
- This manufacturing company was fortunate to have many product models that used very similar test steps. Each product model had different test procedures, but every procedure repeatedly used about 10 unique test step types. This reuse provided great leverage in development costs.
- The test engineers were willing and able to learn how to develop new test sequences to match their well-documented test procedures. Thus, the costs associated with developing new test sequences were minimized.
Conclusion and Next Steps
This article reviews the ways in which an automated test system (ATS) connects to the flow of manufactured products as they move through a company. This flow is captured in a system diagram and a financial model describing the cost of manufacturing test is developed from that diagram. At a high level, the model includes costs from the following diagram components:
- Preparing the unit for testing
- Testing the unit
- Reworking of failed units
- Repairing units at the customer
- Handling warranty issues
- Managing test results held in a database
A financial model and associated equation for unit test cost is developed from these components. Applying this financial model to various ATS options assists in analyzing the tradeoffs of the cost-benefit of the associated ATS designs. We presented an actual example that illustrates the use of this model for three scenarios:
- Manual testing with zero ATS cost
- Automated testing for the highest volume product with a medium ATS cost
- Automated testing for several product models with a high ATS cost
We discussed the outcome of these three scenarios and demonstrated numerically how application of this financial model drives towards a justifiable solution for unit testing.
Many companies frequently choose to build an ATS based mainly on the specifications of the product being tested. They assume that this approach will save the company money. This article presents a tool for justifying the appropriate level of automation for manufacturing test. Do you have an automated test challenge? Are you curious what we would propose? Request a test system consultation.
References
In preparing this article, many sources were reviewed. In general, the analysis of manufacturing test costs has been primarily focused on electronics. This field of study is appropriate since electronic test is so ubiquitous and there is extensive commonality between almost any electronic board, making the results of these studies applicable to a broad range of companies.
Nevertheless, much information presented here is applicable to manufacturing test in general. The suggested sources and references below are worthy of further review.
Some organizations that study the cost of manufacturing in general and test in specific are:
- University of Maryland, Center for Advanced Life Cycle Engineering (CALCE)
- Electronics Systems Cost Modeling Laboratory (ESCML) is a division of CALCE focused on manufacturing cost modeling.
- International Technology Roadmap for Semiconductors (ITRS)
- Focuses on improving the design, build, and test capabilities of semiconductor manufacturers.
- International National Electronics Manufacturing Initiative
- Similar to ITRS, iNEMI roadmaps the technology requirements of the electronics industry and helps to identify and prioritize technology and infrastructure gaps.
Below are a few resources that amend the discussion in this white paper.
- International Technology Roadmap for Semiconductors presentations on test: http://www.itrs.net/Links/2002WinterMtg/PDF/Test.pdf and http://www.itrs.net/Links/2013ITRS/2013Chapters/2013Test_Summary.pdf.
- David Williams, “Manufacturing System Testing Measurement and Management Process”, (2005) Ph.D. Thesis, University of Texas at Austin, https://repositories.lib.utexas.edu/bitstream/handle/2152/1773/williamsd85339.pdf?sequence=2
- David Williams, Anthony P. Ambler, “System Manufacturing Test Cost Model,” 2002 IEEE International Test Conference (ITC), p. 482, International Test Conference 2002 (ITC’02), 2002
- Rosa Reinosa and Carlos Michel, “Manufacturing Test Strategy Cost Model”, NEMI, http://btw.tttc-events.org/material/BTW03/BTW03%20Session%204%20Slides/4-2%20ManufacturingTesStrategyCostModel_2000-Slides.pdf and http://thor.inemi.org/webdownload/projects/ba/Test%20Strategy%20paper.pdf.
- “Course Notes on Manufacturing and Life Cycle Cost Analysis of Electronic Systems”, Peter Sandborn, CALCE EPSC Press, University of Maryland, http://www.enme.umd.edu/ESCML/CostBook/CostBook.htm.
- Thiagarajan Trichy, Peter Sandborn, Ravi Raghavan, and Shubhada Sahasrabudhe, “A New Test/Diagnosis/Rework model for User in Technical Cost Modeling of Electronics Systems Assembly”, 2001 IEEE International Test Conference, http://www.enme.umd.edu/ESCML/Papers/ITC_Test_Econ.PDF